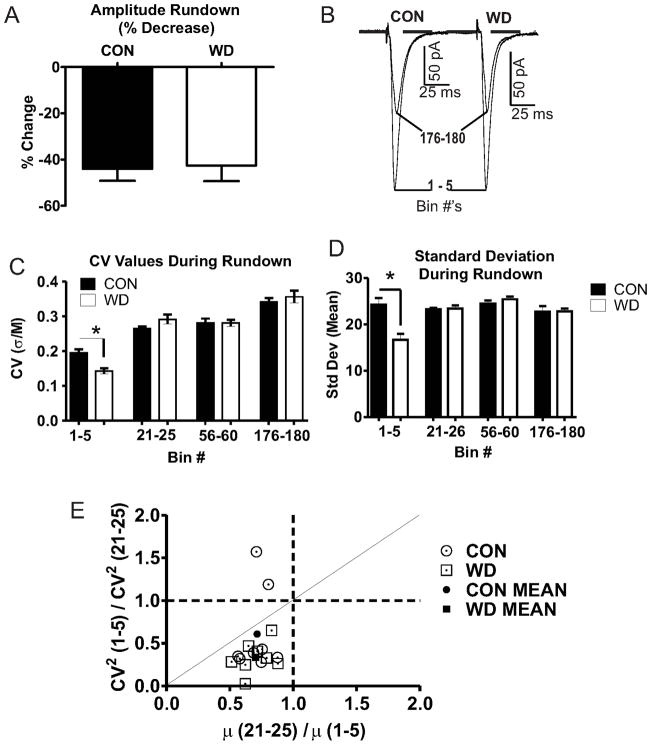
Figure 5. CV analysis localizes WD dependent functional alterations to presynaptic compartments.
A) Absolute EPSC rundown are not different between groups (t = 0.17, df = 14, p > 0.05). B) Representative traces scaled to Bin 1–5 peak values show no change in mean amplitudes. C) CV values (σ/M) decrease in WD (n=8) relative to CON (n=8) during initial rundown [Bin 1–5; t = 4.30 df = 8, * = p < 0.05], but not across extended time points [bins 21–25, t = 1.741, df = 8; bins 56–60, t = 0.02, df = 8; bins 176–180, t = 0.70, df = 8; p > 0.05 for all comparisons]. D) WD decreases σ values during Bins 1–5 [bins 1–5, t = 3.88, df = 8, * = p < 0.05] but not at extended Bin intervals [bins 21–25, t = 0.21, df = 8, p > 0.05; bins 56–60, t = 1.06, df = 8, p > 0.05; bins 176–180, t = 0.03, df = 8, p > 0.05]. E) CV2 analysis characterizing localization of increased WD dependent glutamate function with values on or below the diagonal line suggesting a presynaptic mechanism of action.

