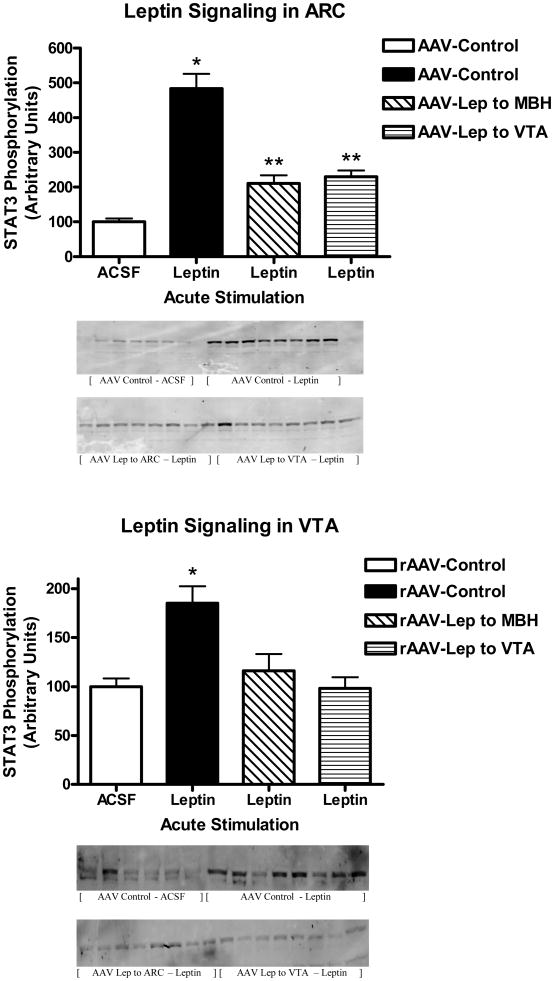
Figure 2.
STAT3 phosphorylation following a single i.c.v. injection of ACSF (open bars) or 1 μg of leptin in rats administered control vector (sold bars), rAAV-leptin into the MBH (hatched bars) or rAAV-leptin into the VTA (stripped bars) 54 days earlier. STAT3 phosphorylation was assessed 1 hour later in the ARC (Top) or VTA (Bottom). Western images of P-STAT3 are below figure.
Values represent the mean ± SE of 6-8 rats per group. The value of ACSF injected control for each individual tissue is arbitrarily set to 100 with SE adjusted proportionally with remaining groups normalized to the level in ACSF injected control. P< 0.001 for difference with leptin injection in P-STAT3 levels in ARC or VTA by one-way ANOVA. Top: *P<0.001 for difference between leptin injection and ACSF among AAV-Control by Bonferroni post-hoc analysis; **P<0.05 for difference between leptin injection and ACSF and P<0.001 for difference between rAAV-control and either rAAV-leptin to MBH or rAAV-leptin to VTA among leptin injected by Bonferroni post-hoc analysis. Bottom: *P<0.001 for difference between leptin injection and ACSF among AAV-Control by Bonferroni post-hoc analysis.

