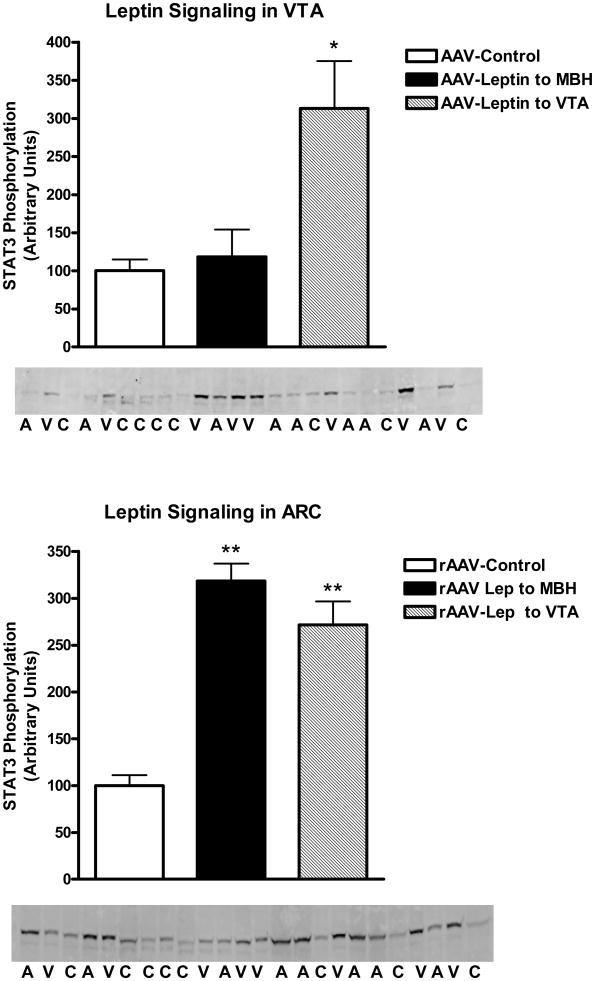
Figure 4.
STAT3 phosphorylation in the VTA (Top) or ARC (Bottom) following treatment for 9 days with control vector (open bars), rAAV-leptin into the VTA (solid bars) or rAAV-leptin into the ARC (hatched bars). STAT3 phosphorylation represents that stimulated by leptin gene delivery. No further exogenous leptin was administered. Western images of P-STAT3 are below figure. C: AAV-Control; A: AAV-Leptin to MBH; V: AAV-Leptin to VTA.
Values represent the mean ± SE of 7-8 rats per group. The value of rAAV-Control for each individual tissue is arbitrarily set to 100 with SE adjusted proportionally with remaining groups normalized to the level in rAAV-Control. P< 0.001 for difference with rAAV-leptin treatment for leptin signaling in VTA (top) and ARC (bottom) by one-way ANOVA; *P<0.01 for difference between rAAV-Leptin to VTA and rAAV-Control by Bonferroni post-hoc analysis; **P<0.001 for difference between either rAAV-leptin into the MBH or VTA and rAAV-Control by Bonferroni post-hoc analysis.

