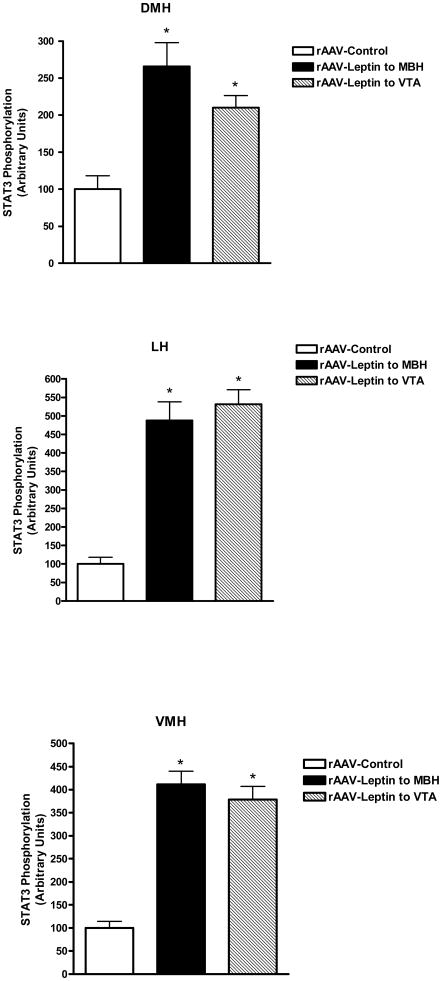
Figure 5.
STAT3 phosphorylation in the DMH, LH or VMH following treatment for 9 days with control vector (open bars), rAAV-leptin into the VTA (solid bars) or rAAV-leptin into the MBH (hatched bars). STAT3 phosphorylation represents that stimulated by leptin gene delivery. No further exogenous leptin was administered.
Values represent the mean ± SE of 7-8 rats per group. The value of rAAV-Control for each individual tissue is arbitrarily set to 100 with SE adjusted proportionally with remaining groups normalized to the level in rAAV-Control. P< 0.001 for difference with rAAV-leptin treatment for leptin signaling in DMH, LH, or VMH by one-way ANOVA; *P<0.001 for difference between rAAV-Leptin treated and corresponding rAAV-Control by Bonferroni post-hoc analysis.

