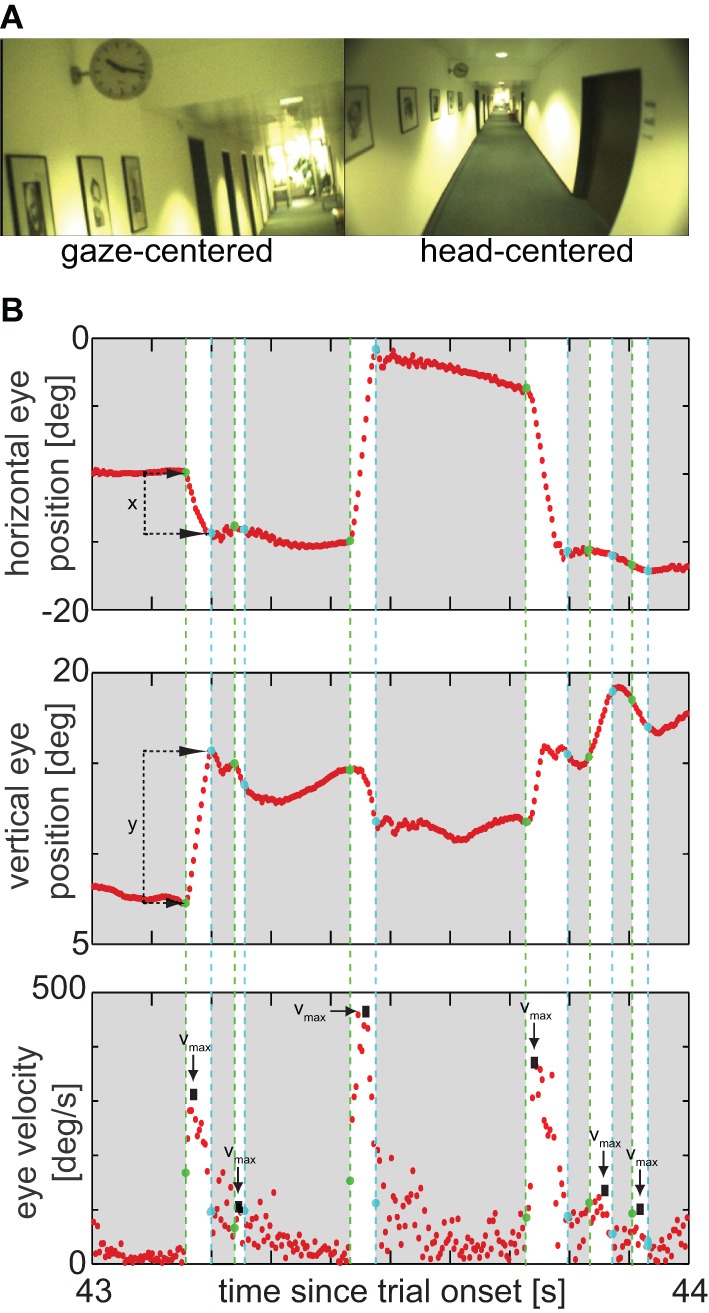
Figure 1.

(A) Example frame at 43.81 s in the real-life measurement, while a PD patient was looking at the clock; left: gaze camera, right: head camera. The movie of this scene including velocity histograms is shown as supplemental online Movie 1. (B) Eye-traces of the scene. Upper panel: Horizontal eye position, indicating the horizontal amplitude of saccades; starting and end points of saccades are marked by green and cyan dashes lines, respectively; durations of saccades are highlighted by a white background. Middle panel: Vertical eye position, indicating the vertical amplitude of the same saccades. Lower panel: Absolute eye velocity, arrows mark saccade peak velocities, used for analysis.
