
Figure 2.
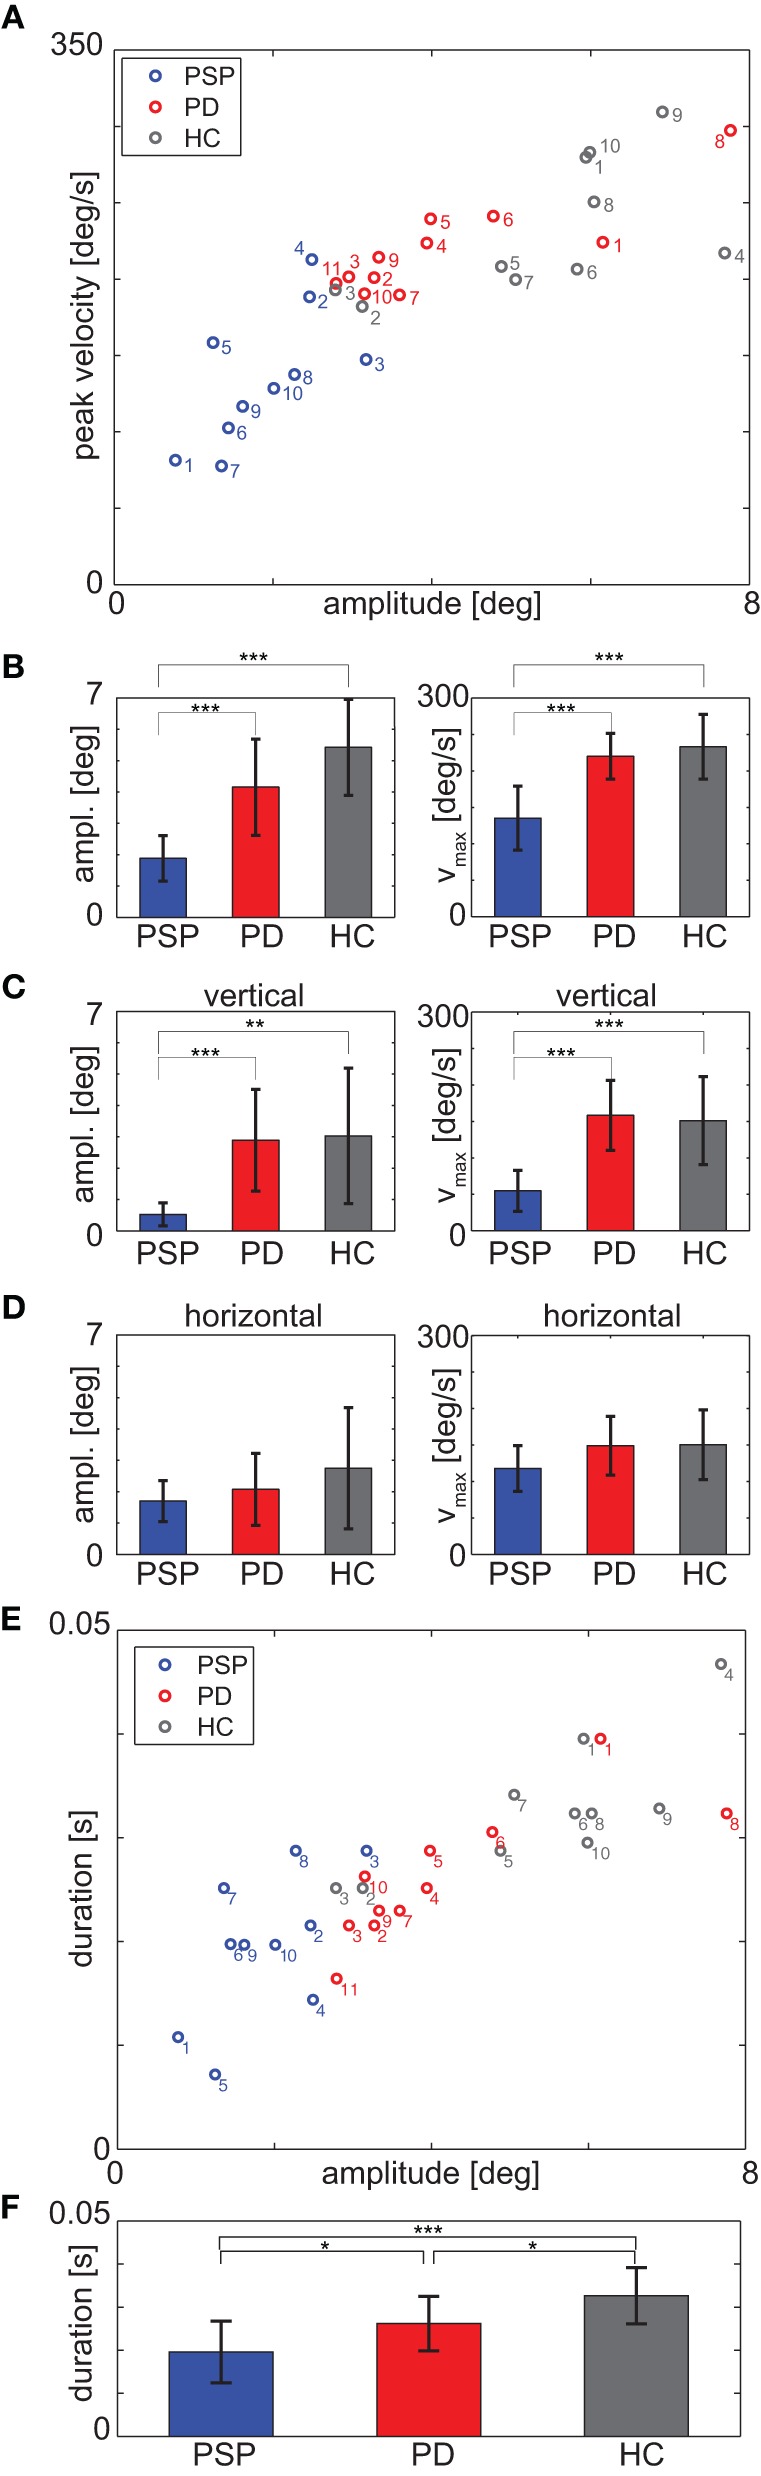
(A) Medians of saccade peak velocity and amplitude for each participant during the fixation protocol. (B) Mean over participants of median amplitude (left panel) and median peak velocity (right panel) for each group. (C) Vertical component and (D) horizontal component of the data of panel (B); (E) Medians of saccade duration and amplitude for each participant during fixation protocol; note that the duration is discretized due to sampling frequency (F). Mean over participants of median duration. *p < 0.05; **p < 0.01; ***p < 0.001.