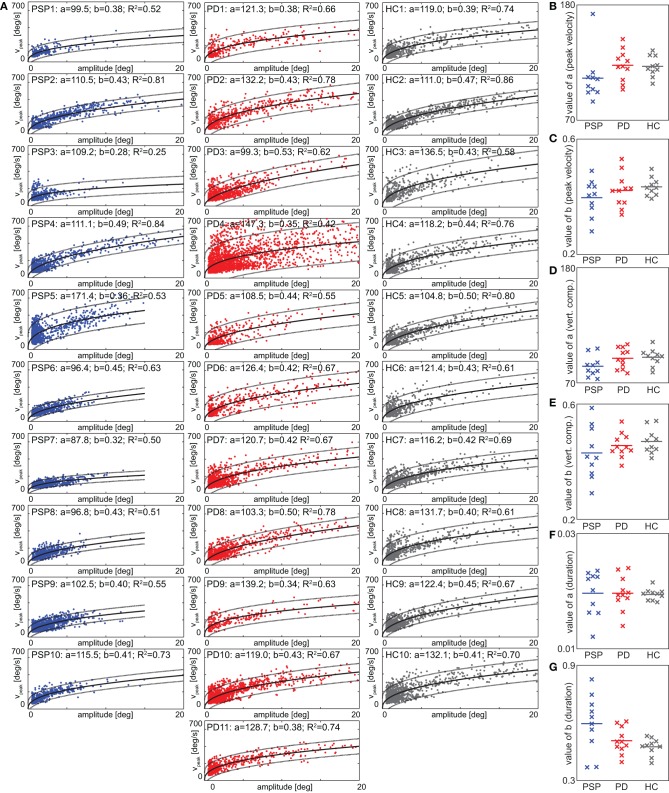
Figure 4.
(A) Saccade peak velocity plotted against saccade amplitude (“main sequence”) for all individuals. Each data-point corresponds to one saccade (note the cutoff to the bottom and left, given by the thresholds on velocity and duration). Solid black line denotes best fitting power functions (see section “Eye Movements”) in a least-squares sense, dotted lines 5 and 95% confidence intervals. Fit parameters and R2 are given in the panel headers. (B,C) Main-sequence fit parameters of the functional relationship between peak velocity and amplitude. (D,E) Main-sequence fit parameters for the functional relationship between vertical component of peak velocity and amplitude. (F,G) Main-sequence fit parameters for the functional relationship between saccade duration and amplitude.

