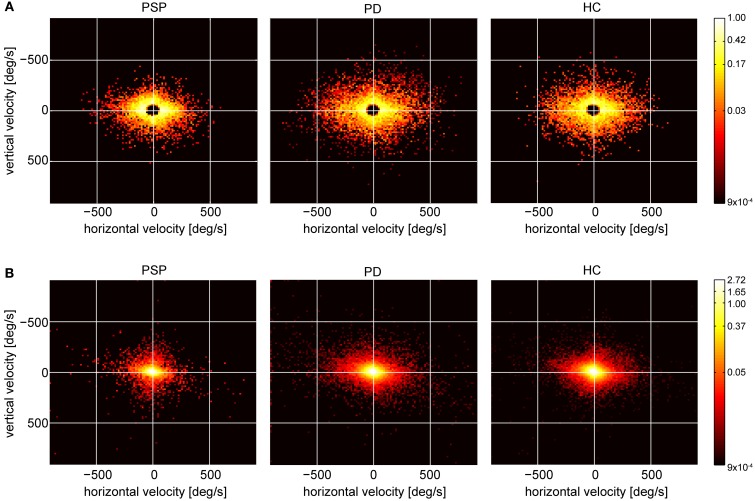
Figure 5.
(A) Peak velocity histograms of cumulated saccades of all participants in each group (range: −900 to 900°/s in the cardinal directions, bin size: 15° × 15°/s). (B) Velocity histograms of raw eye velocities of all cumulated data points of all participants in each group, same range, and bin size as in (A).

