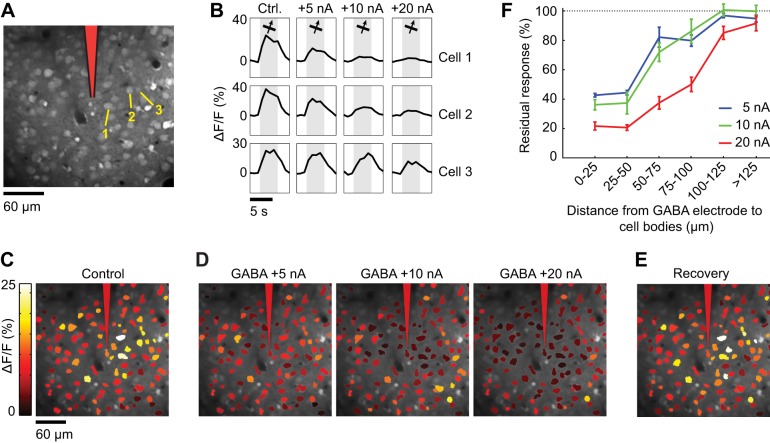
Figure 9.
Spatial extent of suppression during GABA iontophoresis. (A) Calcium indicator loading in cells 230 μm below the pia. After bulk loading of OGB-1 AM, an iontophoresis electrode was inserted at the position indicated in red. (B) Calcium responses to the preferred direction of motion in three neuronal cell bodies (labeled in A) in the absence of GABA (Ctrl.) and during GABA iontophoresis. Each trace is the average response to 10 repeats. More current is required to suppress the responses as the distance between the electrode and the neuron increases. (C) Cell map showing the average response to the preferred direction (65°) before GABA iontophoresis. (D) Average response to the preferred direction during GABA iontophoresis at different current levels. (E) Recovery of somatic responses 20 min after cessation of GABA iontophoresis. (F) Residual response (see “Materials and Methods”) at different current amplitudes, as a function of the distance between the GABA iontophoresis electrode and neuronal cell bodies (mean ± SEM).

