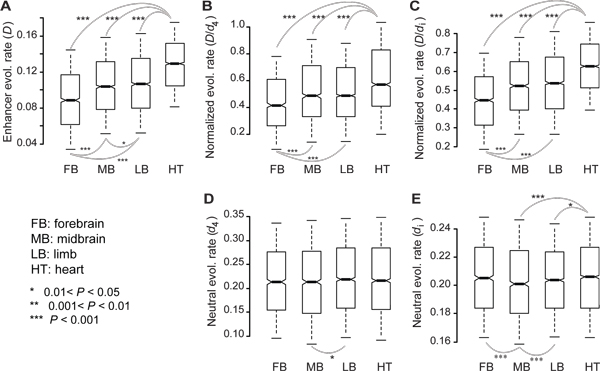
Figure 1.
Evolutionary rates of enhancers. Rates of evolution calculated for mouse enhancers of embryonic forebrain (FB), midbrain (MB), limb (LM), and heart (HT), included D (A), normalized evolutionary rates D/d4 (B) or D/di (C), and neutral substitution rates d4 (D) or di (E). The values of upper quartile, median, and lower quartile are indicated in each box, whereas the bars outside the box indicate semi-quartile ranges. D, D/d4, D/di, d4 and di were computed based on mouse-rat alignments. Pairwise comparisons showing significant differences in D, D/d4, D/di, d4, or di are connected with gray lines (Mann-Whitney U test).

