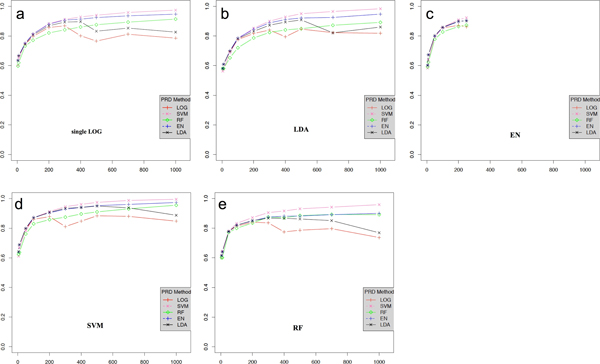
Figure 1.
Prediction performance according to feature selection method (a) logistic regression (LOG), (b) linear discriminant analysis (LDA), (c) Elastic Net (EN), (d) support vector machine (SVM), and (e) random forest (RF) varying # of SNPs used in prediction for CPD10. X-axis represents the # of SNPs, Y-axis stands for the AUC score.

