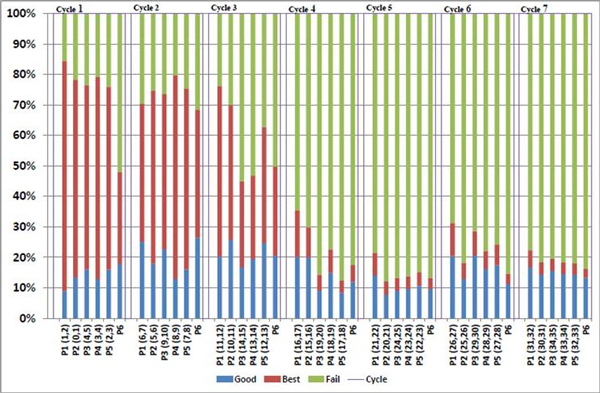
Figure 4.
The decline of the good-and-best beads ratio observed during the sequencing of the palindromic library by SOLiD 5500xl. The beads quality is indicated by colour: blue for good beads, red for best beads and green for bad beads. Their percentages are shown in Y-axis. Only sequences from the good beads (blue bar) and best beads (red bar) can be used for analysis. A total of five primers (P1-5) have to be used for each sequencing run. (Notice that P6 is an ECC primer, which was not used for sequence reading.) In this study, each sequencing run lasted for 7 ligation cycles to complete the 35 bp sequence length. The positions of each two-base encoding for each primer cycle are shown within the parenthesis right behind the primer. In the library, every template comprises a tag of 17-18 bp, followed by the palindromic region of 26 bp, and then another tag (also 17-18 bp). During the first two cycles, corresponding to the tag region, the percentages of good and best beads seemed to be quite normal. The initial decline of good-and-best beads ratio was seen in P3(14, 15) and P4(13,14), and an overwhelming decline observed across all primers started from the fourth cycle when sequencing entered the palindromic region.

