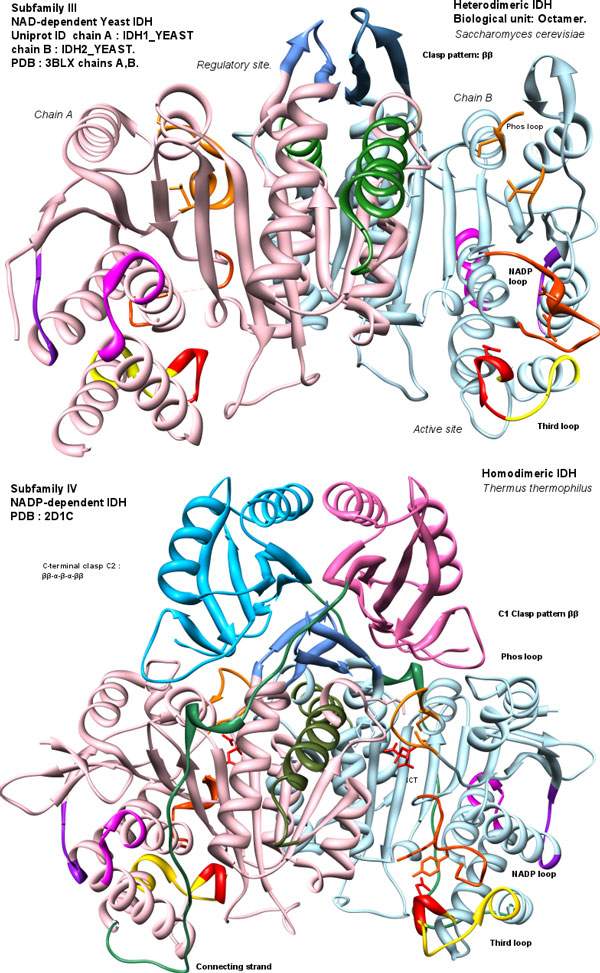
Figure 5.
Structures of subfamily III and IV. Structures of subfamily III (top) and IV (bottom)are shown for comparison. Colors are consistent with regions in Figure 3. The sequentially central homologous clasp region (C1) in subfamilies III and IV is reduced to a two-strand anti-parallel sheet (ββ) (residues 148-160 in TtIDH), and is similar in both. C-terminal forms a larger domain over the clasp (C2). Images were made with Chimera [80].

