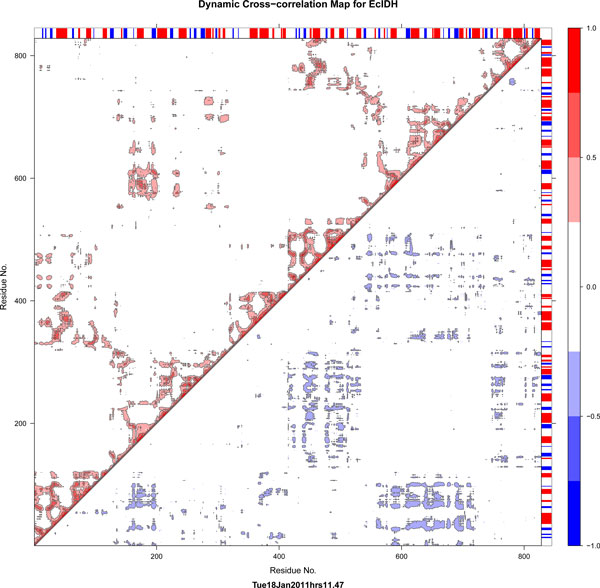
Figure 8.
Correlation map for S1-IDH. Normalized Correlation map representative for dimeric S1-IDH (E.coli). The symmetric correlation matrix has been split, with lower triangle showing only negative values and upper triangle showing only positive values. Numbering of residues is continuous for each dimer (1- > ~800).

