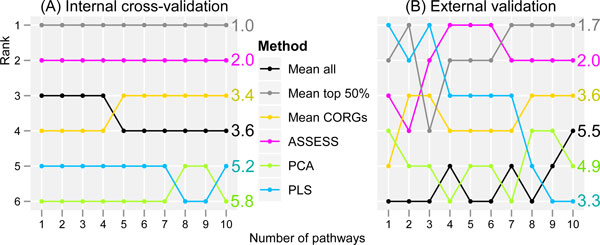
Figure 4.
Overall accuracy ranking of the methods combined across the datasets. Combined accuracy ranking of each method is plotted as a function of the number of top pathways. The numbers in the right of the plots are the average rank across the ten feature set sizes. (A) Internal cross-validation. (B) External validation.

