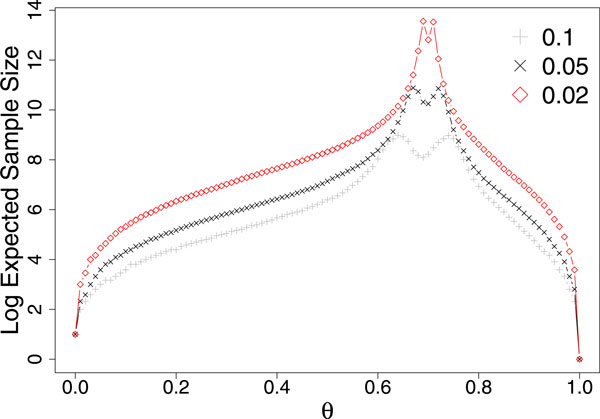
Figure 2.
Log2 expected value of n at which the Younes B algorithm terminates and returns a TRUE/FALSE/UNDECIDED answer for different values of δ (0.02, 0.05 and 0.1) at varying θ with α = 0.01, β = 0.01, γ = 0.01 and p = 0.7. This figure demonstrates that with decreasing δ, the expected n increases.

