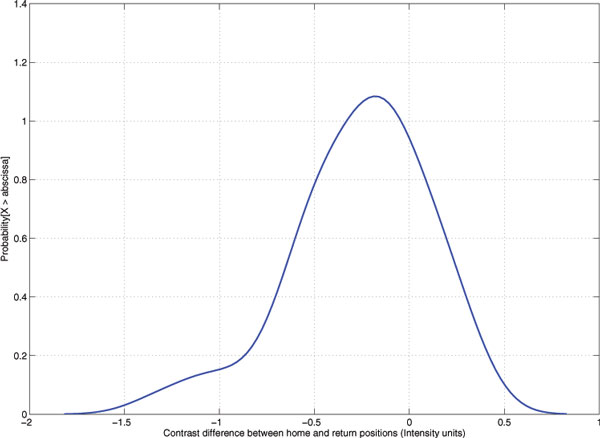
Figure 2.
Error distribution of contrast differences between the home position before and after movements. The acquisition unit was set to move the microscope stage upward from the start point (set as home position) 500 steps, and then back to home position. The Root Mean Square (RMS) in equation 1 is utilized for computing image contrast for each movement. The error distribution of RMS differences between the home position and the position after upward and downward movement (return position) are plotted. The mean and standard deviation of the error are -0.263 and 0.357 respectively.

