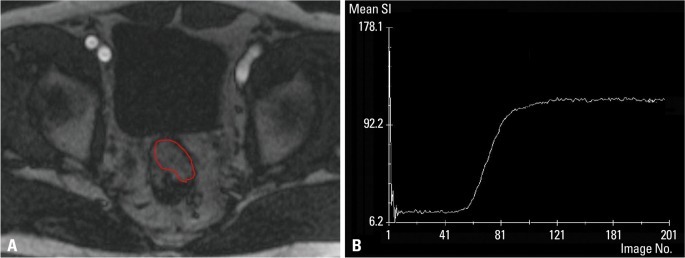
Fig. 1.
Measurement of DCE-MRI. (A) On DCE-MRI, a ROI was freely drawn within the tumor to encompass the largest area of enhancement. (B) A time-signal intensity curve was generated at a workstation using commercially available software. DCE-MRI, dynamic contrast-enhanced magnetic resonance imaging; ROI, region of interest.

