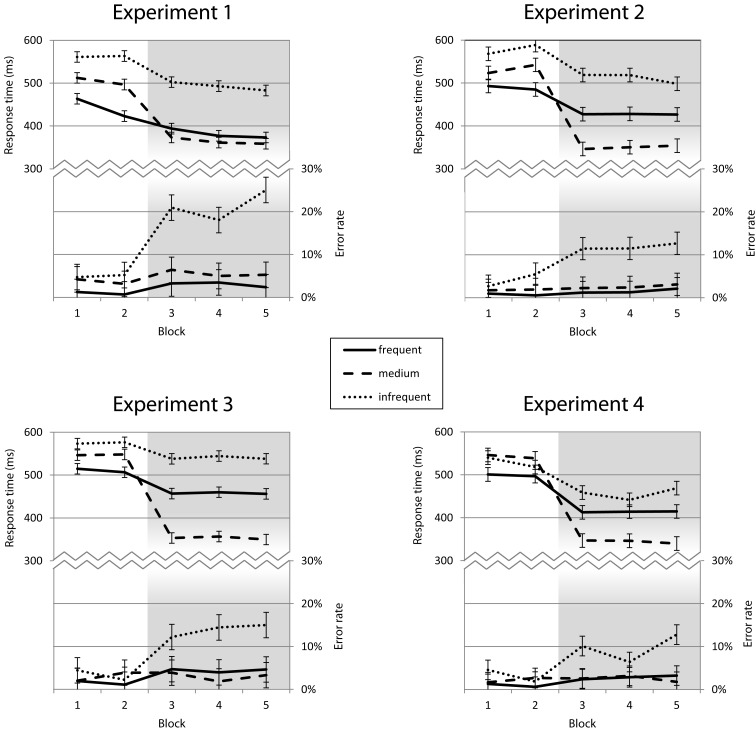
Figure 2.
Response times and error rates for Experiments 1–4. Response times (on the top of each panel) exhibit an effect of stimulus frequency (with the frequent stimulus, marked by the solid line, leading to faster responses than the medium and infrequent stimuli) in the first two blocks, as well as an effect of the additional task goal starting in the third block (with the reinforced medium stimulus getting faster responses). The same pattern is visible in conditions with verbal predictions (Experiment 1) and without (Experiment 2) and also with low and high validity non-verbal cues (Experiments 3 and 4).

