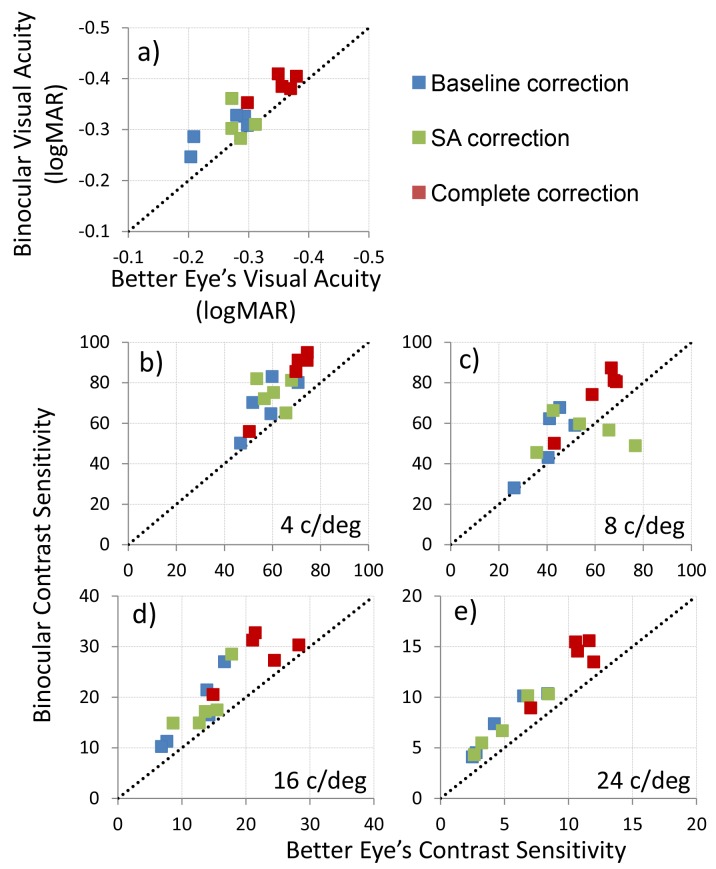
Fig. 6.
Binocular vs. better monocular visual acuity (a) and contrast sensitivity (b)-(e) for the three optical conditions. Each data point represents the visual performance for one subject for one correction condition under monocular (x-axis) and binocular (y-axis) viewing. The dashed line represents equality in visual performance between binocular and monocular viewing.

