Figure.

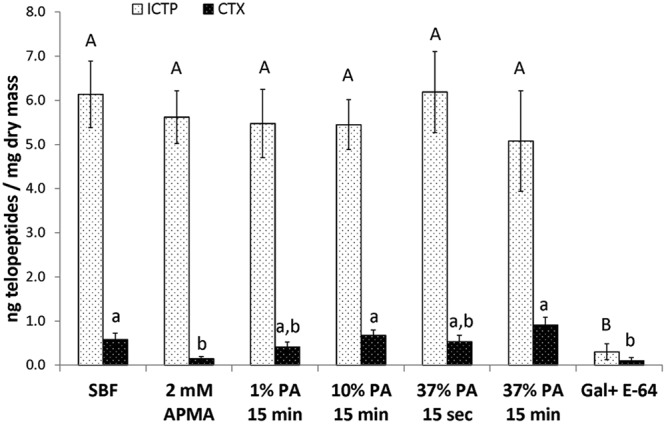
Bar chart of C-terminal telopeptide (ICTP and CTX) release from EDTA-demineralized dentin beams after various treatments with increasing concentrations of phosphoric acid. Values are ng telopeptide/mg dentin dry-wt/3 days. Bar heights are mean values (n = 10); brackets indicate ± SD. Bars identified by different letters are significantly different. APMA = 2 mM p-aminophenylmercuric acetate pre-treatment for 2 hrs at 37°C. PA = phosphoric acid. SBF = simulated body fluid. Bars identified with similar upper-case letters are not significantly different (p > 0.05) by one-way ANOVA for effects of treatments on ICTP release rate. Bars identified by different lower-case letters are significantly different (p < 0.05) by one-way ANOVA followed by Tukey’s test for effects of treatments on CTX release rate. Gal/E-64 refers to group 7, where the incubation medium contained 200 µM galardin, a potent MMP inhibitor, and E-64, a cathepsin inhibitor.
