
Figure 1.
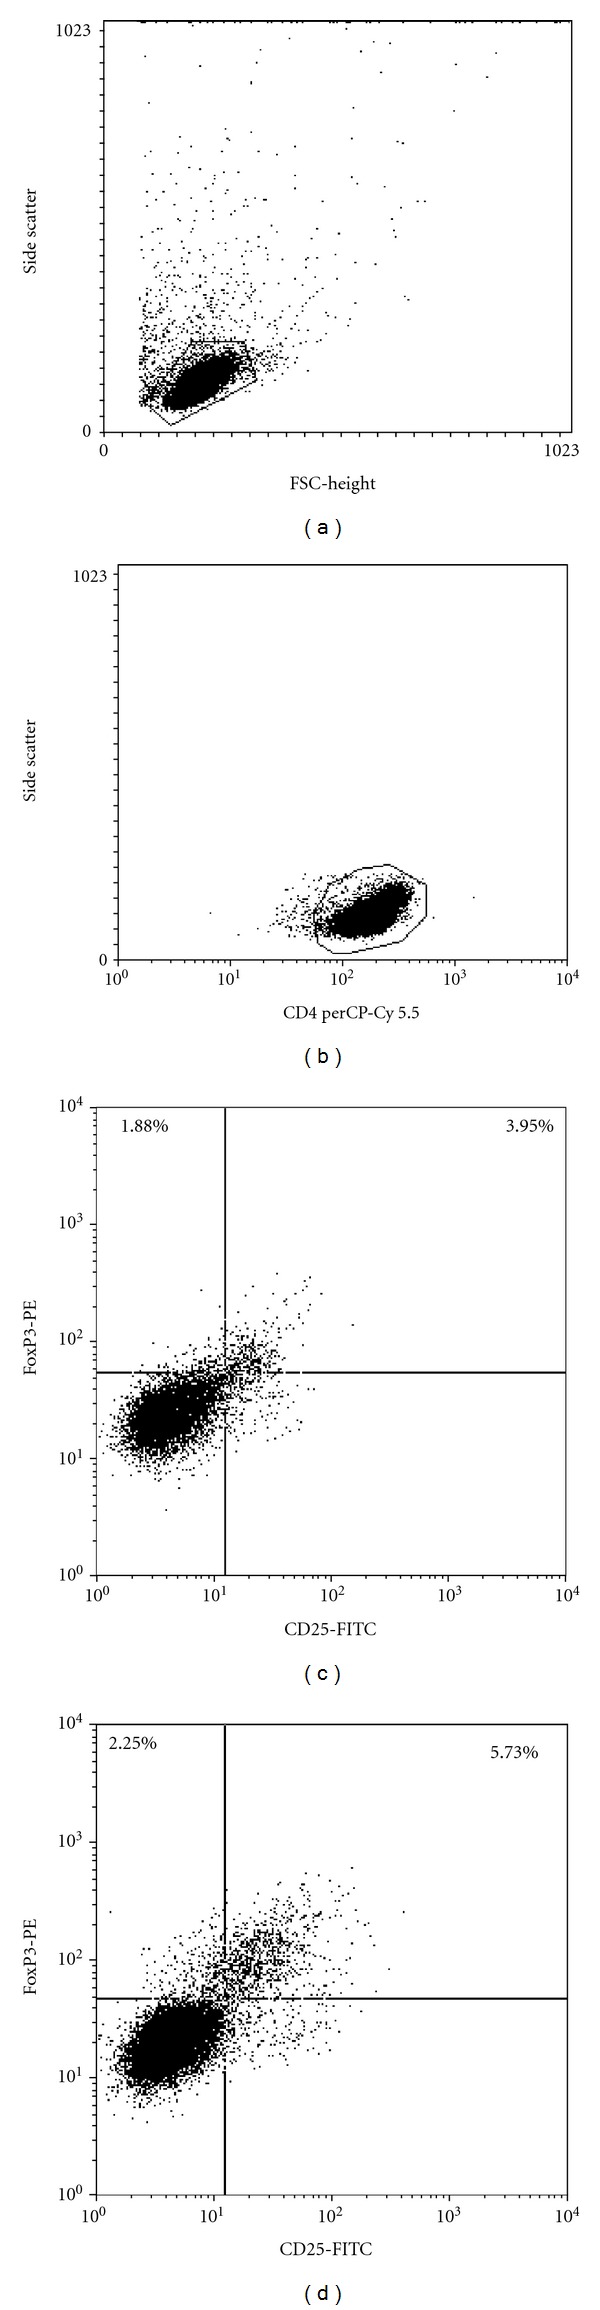
A representative dot plot showing the expression of CD25 and FoxP3 markers by T helpers. Panels (a) and (b) show the homogeneity of the purified CD4+ population; (c) shows the percentage of FoxP3+ cells in control culture; (d) shows an increase of the percentage of cells expressing FoxP3 after being cultured in AT-MSCs conditioned medium.