
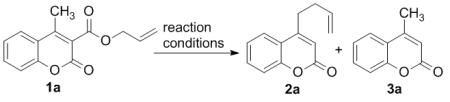
Table 1.
Optimization of Reaction Conditions.[a]
| Entry | Catalyst | Solvent | Yield (%)[b] | 2a:3a [b] |
|---|---|---|---|---|
| 1 | 5 mol% Pd(PPh3)4 | tol-d8 | 99 | 77:23 |
| 2 | 5 mol% Pd(PPh3)4 | CD3CN | 65 | 63:37 |
| 3 | 5 mol% Pd(PPh3)4 | DMF-d7 | 95 | 80:20 |
| 4 | 5 mol% Pd(PPh3)4 | THF-d8 | 87 | 83:17 |
| 5 | 3 mol% Pd2(dba)3, 6 mol% dppe |
tol-d8 | 75 | 70:30 |
| 6 | 3 mol% Pd2(dba)3, 6 mol% dppb |
tol-d8 | 67 | 77:23 |
| 7 | 3 mol% Pd2(dba)3, 6 mol% rac-BINAP |
tol-d8 | 77 | 70:30 |
| 8 |
3 mol% Pd2(dba)3,
6 mol% Xantphos |
tol-d8 | 99 | 94:6 |
| 9 | 3 mol% Pd2(dba)3, 6 mol% Xantphos |
DMF-d7 | 80 | 80:20 |
| 10 | 3 mol% Pd2(dba)3, 6 mol% dppf |
tol-d8 | 75 | 72:28 |
[a]
All reactions were carried out at 70 °C for 12 h, 0.1 mmol scale, 0.2 (M).
[b]
Yields and product distributions were determined by 1H NMR.