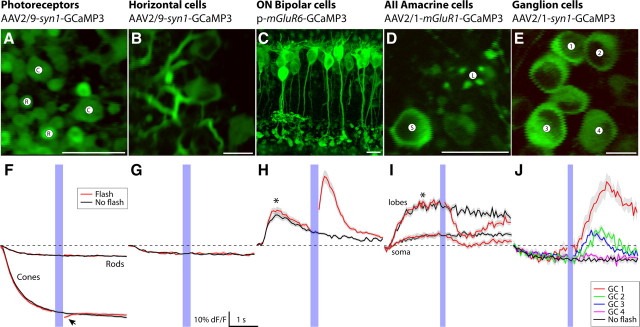
Figure 2.
Summary of vectors and their target neurons in mouse retina. For each retinal neuron class (top), we identified a vector that targets gene expression to some or all of its constituent neuron types. A–E, Fluorescence images of GCaMP3-expressing neurons representative for each class. Two-photon microscopy resolved all labeled structures with submicrometer resolution. Images represent the average fluorescence image obtained from 3 to 10 no-flash trials (<2 min recording time). Scale bar, 10 μm. D, Cross section through soma (S) and lobular appendage (L) of a labeled type AII amacrine cell. F–J, Stimulus evoked fluorescence responses representative for the labeled neuron types shown in A–E. Flash, Fluorescence response to a brief blue light flash (458 nm LED, 125 ms duration, 100 μW/cm2); no flash, scan laser only (red and black solid lines; average ± 1 SD shown in gray). The traces show the fluorescence response measured from the respective images shown in A–E, except the bipolar cells, where an image obtained from retinal slice is shown for clarity, while fluorescence was recorded from a dendritic arbor in a whole-mount retina [arbor shown (see Notes)]. F, Fluorescence signal in cone terminals decreased from scan laser onset; the arrowhead indicates additional fluorescence decrease in response to the LED stimulus. H, I, The asterisks indicate fluorescence response evoked by scan laser onset. J, Responses recorded from four different ganglion cells (annotated in E; not all cells shown for clarity). Fluorescence signals show response heterogeneity expected from different ganglion cell types. Movie clips for these recordings can be viewed online (see Notes).

