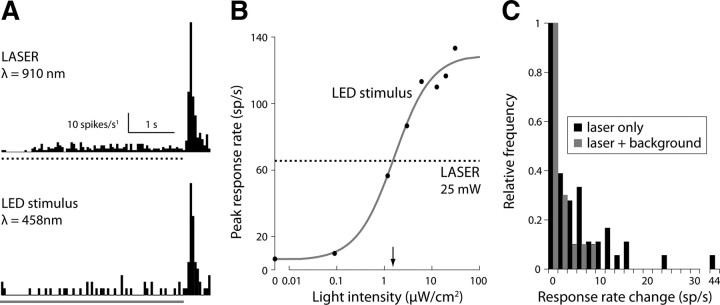
Figure 5.
Light-adapting background minimized scan laser-evoked light responses. A, Peristimulus time histogram of an OFF-type ganglion cell spike response to the scan laser (top, dotted line) and blue LED (bottom, blue line). The cell responds strongly when either stimulus is turned off. B, Peak amplitude of the response evoked by the scan laser (dotted line), and LED stimulus at increasing intensity (black dots; blue curve, sigmoidal fit: basis e−1/x expanded with two offset parameters and one linear scale parameter). Response amplitudes matched at a visible light intensity of ∼1.7 μW/cm2 (arrow), equivalent to 400 photoisomerizations/s per M-cone. C, Changes in ganglion cell spike rate evoked by the scanning laser in the presence (n = 16 cells; blue) and absence (n = 48 cells; black) of adapting background illumination (2.5 μW/cm2; 440 ± 20 nm; LED light source). Adding the background eliminated the high spike frequencies characteristic of the response to laser scanning.

