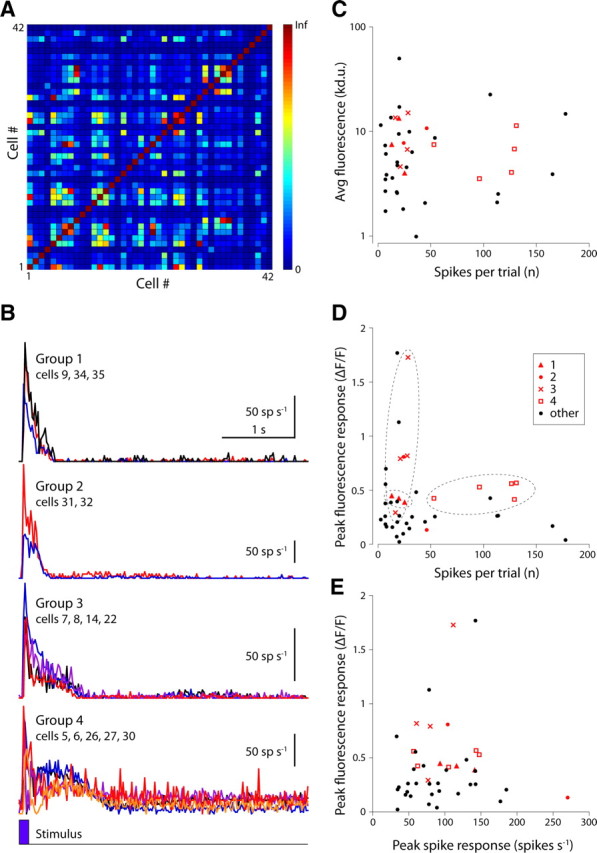
Figure 8.

Sensor gain varied across ganglion cells of the same functional type. Ganglion cells were grouped by functional type based on their spike response to a brief light flash. A, Similarity (see Results for details) of flash-evoked spike responses for all pairwise combinations of recorded cells (n = 42). B, Spike responses of all cells in each of four different groups (averaged into 50 ms bins). Each trace represents the average flash-evoked spike response (>10 repeats) of a single ganglion cell. The plot includes data shown in Figure 7. C–E, Scatter plots of various representations of the fluorescence response gain for all recorded cells (n = 42). Red symbols, Cells identified in the clusters shown in B; black symbols, all other cells.
