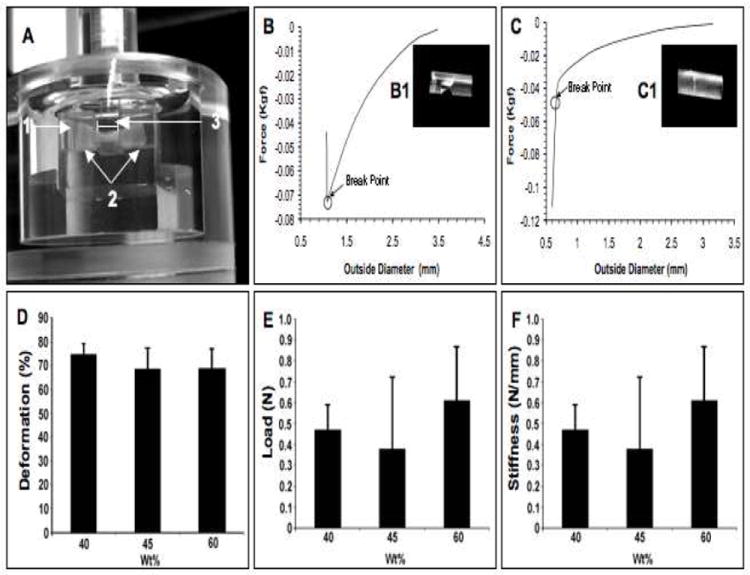
Fig. 3. Mechanical compression test of gelatin tubing.

(A) A custom-made chamber was filled with PBS (1) and the gelatin tube was placed horizontally (2). Lateral compression was initiated using a 3 mm wide indenter (3) The load-deformation curve and break points of transverse failure (B), axial failure (C) and the characteristic rupture of the tube after loading (B1-C1) are shown. The graphs present data for mechanical deformation (D), ultimate load (E) and stiffness (F).
