
Figure 4.
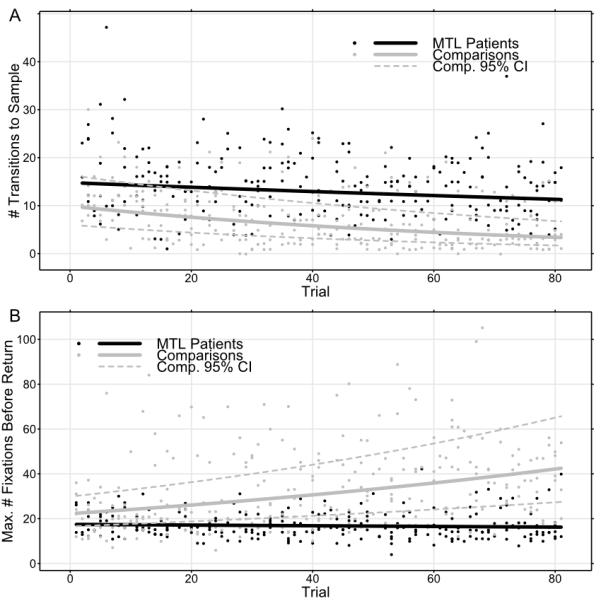
Evidence of learning across the course of the experiment as reflected in eye-movement measures. Both plots show individual values and best-fit regression functions. (a) Comparisons fixated the sample item less and less frequently as the experiment continued, while MTL patients continued fixating the sample item at approximately the same rate throughout. (b) Likewise, comparisons made longer and longer forays from the sample item across the course of the experiment, fixating more items before returning. The lengths of patients’ search paths were stable across the entire experiment.