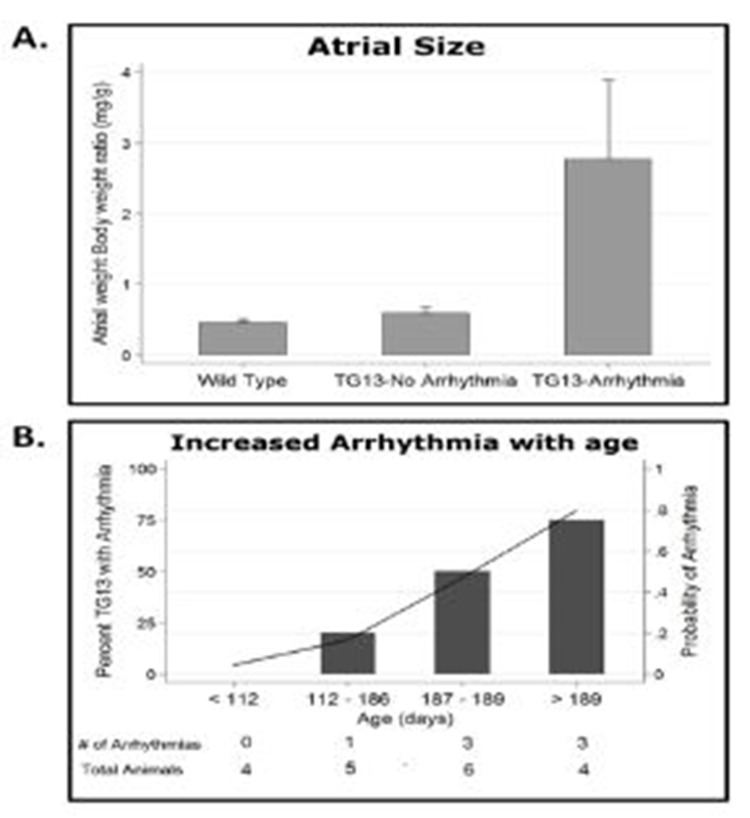
Figure 3. Relationship of atrial size and age to arrhythmia in DN-MSTN TG13 mice.
A. AW/BW ratio is increased in DN-MSTN TG13 mice with arrhythmia compared to WT or DN-MSTN TG13 mice without arrhythmia, p<0.01 for both, p=NS for WT vs. DN-MSTN TG13 without arrhythmia. B. Increased probability of arrhythmia with increasing age in DN-MSTN TG13 mice. Shown is DN-MSTN TG13 mice divided in quartiles based on age (N=4, 5, 6, 4 for quartiles 1 – 4). On the left axis (bars) is the percentage of animals with arrhythmia in the quartile. The right axis (line) demonstrates the trend for probability of arrhythmia with increasing age based on a logistic regression model (OR 4.41, CI 1.10 – 17.8, p<0.01). The addition of an interaction term including AW/BW and age improved the model (Pseudo-R2 increased from 0.175 to 0.715, p<0.001), although AW/BW did not increase significantly with age for either group (R2=0.0191, p=NS for WT; R2=0.0314, p=NS for DN-MSTN TG13). Shown below the graph is the number of DN-MSTN TG13 animals in each quartile with arrhythmia over the total number of DN-MSTN TG13 animals in each quartile.

