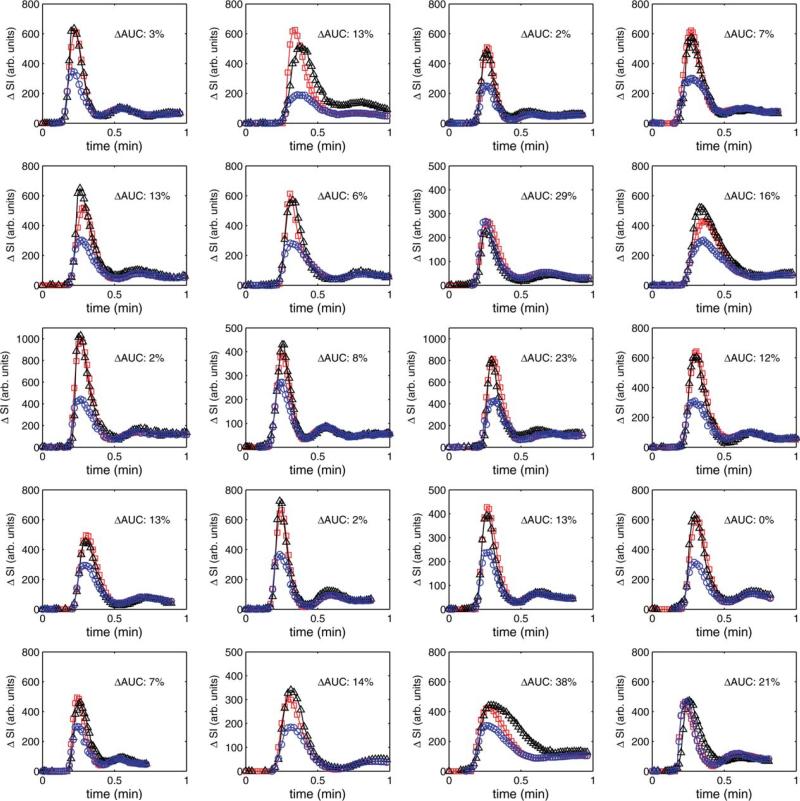
FIG. 7.
Dual-bolus and estimated AIFs from 20 patients. The CAMM estimated AIF is shown in red (squares), and the dual-bolus AIF is shown in black (triangles). In each case, the directly measured LV blood pool signal is also shown for comparison in blue (circles). The percent differences in the area under the curve of the first pass of the dual-bolus and CAMM AIFs are also shown. The dual-bolus AIFs were acquired 3–7 min before the full-dose measured AIFs.

