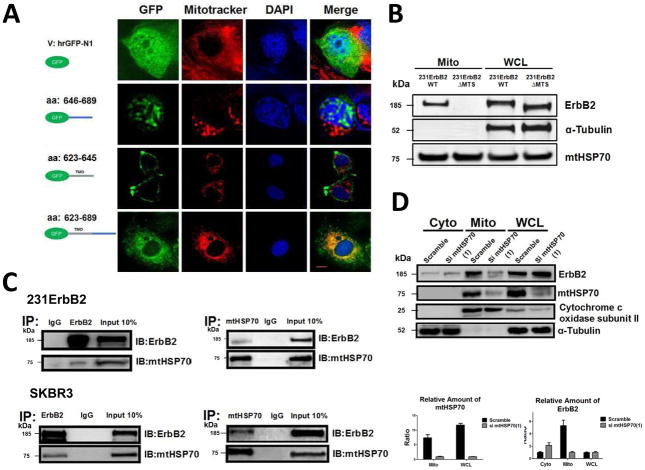
Fig. 2.
Analysis of the mechanisms of mtErbB2 mitochondrial localization. (A) MCF7 breast cancer cells were transfected with plasmids encoding either GFP alone, or GFP fused ErbB2 fragments GFP-646–689, GFP-623–645 or GFP-623–689. Cells were cultured and the florescent imaging was done as described under the “Methods.” Scale bars: 20 μm. (B) MDA-MB-231 cells were transfected with wild-type ErbB2 and ErbB2ΔMTS vectors and mitochondrial proteins were extracted. ErbB2 expression was measured by Western blotting analysis; α-Tubulin and mtHSP70 were loading controls. (C) Mitochondrial proteins were isolated from MDA-MB-231ErbB2 cells and immunoprecipitated with ErbB2 antibody. The immunoprecipitates were probed with anti-mtHSP70 and anti-ErbB2 (top left). Mitochondrial proteins from the same cells were precipitated with mtHSP70 antibody and the immunoprecipitates were probed with anti-mtHSP70 and anti-ErbB2 (top right). IgG was used as a negative control. Isolated mitochondrial proteins (input) were loaded as a positive control. Similar results were obtained using another breast cancer cell line, SKBR3 (bottom). (D) siRNA specific to mtHSP70 was transfected into MDA-MB-231ErbB2 cells. The cytoplasmic fraction (Cyto), mitochondrial fraction (Mito) and whole cell lysate (WCL) were separated for western blotting analysis (left). Cytochrome c oxidase subunit II and α-Tubulin were makers and loading controls for the mitochondrial fraction and the cytoplasmic fraction, respectively. The relative protein amounts of ErbB2 and mtHSP70 were calculated by determining the intensity of the protein bands followed by the normalization with loading controls (right). Experiments were repeated three times. Columns, mean of three independent experiments; bars, SE.

