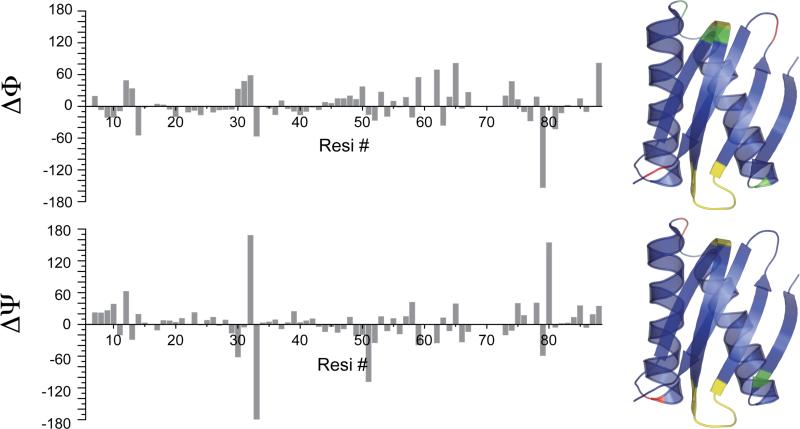
Figure 7.
Residue-wise comparison of Φ and ψ torsion angles predicted by TALOS+43 and those extracted from LC8 crystal structure (PDB file 2PG126). Differences are mapped on the 2PG1 chain A, and residues are color coded as follows: blue for ΔΦ and Δψ smaller than 50 degrees; green for ΔΦ and Δψ ranging from 50 to 100 degrees; red for ΔΦ and Δψ larger than 100 degrees. Residues with no predicted angles due to the lack of resonance assignments are colored yellow (R60, N61, H68, E69, T70, R71 and H72).

