Figure 8.
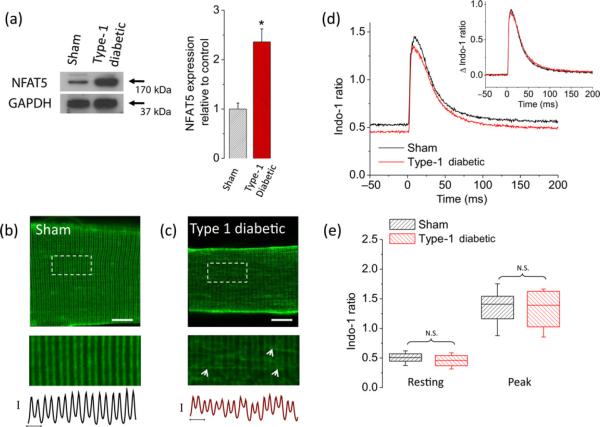
Fibers from type 1 diabetic mice display an increase in NFAT5 expression and transverse tubule system disruption but no changes in electrically evoked Ca2+ transients. (a) Left, Western blot analysis of whole cell homogenates prepared from TA muscles from sham, non-diabetic mice or from type 1 diabetic mice. The blot is representative of three independent experiments, three mice per condition. Right, quantification of Western blot data indicates a substantial increase of NFAT5 expression in type 1 diabetic mice. *Indicates P < 0.05 compared with sham, non-diabetic control. Representative confocal images of the transverse tubule morphology of FDB fibers isolated from sham, non-diabetic (b) (n = 30 fibers, four mice) and type 1 diabetic mice (c) (n = 30 fibers, four mice) and stained with di-8-ANEPPS. Scale bar: 20 μm. Bottom images are zoom-in versions of boxed regions indicated in panels (b) and (c). Traces below zoom-in images are averaged fluorescence profiles across the box, vertical scale bar: 500 A.U.; horizontal scale bar: 2 μm. Di-8-ANEPPS staining reveals that transverse tubule morphology is disrupted in fibers from diabetic mice. (d) Time course of electrically evoked Ca2+ transients, using the Ca2+ indicator indo-1, from single muscle fibers from sham, non-diabetic mice (black trace; n = 31 fibers, four mice) and from type 1 diabetic mice (red trace; n = 35 fibers, four mice). Inset, Δ indo-1 ratio (Δ indo-1 ratio = (indo-1 ratio) – (resting indo-1 ratio)), shows negligible differences in the amplitude and kinetics of electrically evoked Ca2+ transients from fibers isolated from type 1 diabetic mice when compared with sham, non-diabetic counterparts. (e) Box-plot summary of indo-1 ratio measurements at rest and peak; median indo-1 ratio values are shown by solid lines within each box on distribution plots. Box upper and lower limits represent the 75th and 25th percentiles, respectively; the extended lines indicate the 10th and 90th percentiles. No significant changes in resting or peak indo-1 ratio values were found in fibers from type 1 diabetic mice when compared with control counterparts. For experiments using FDB fibers from diabetic mice in panels (b)–(e), glucose in media was maintained at the same levels as found in vivo (average plasma glucose in type 1 diabetic mice was 22 mmol/L). One day after plating, FDB fibers from type 1 diabetic mice and sham, non-diabetic mice were stained with Di-8-ANEPPS or loaded with indo-1 AM (see Materials and methods) and then resting ratio and electrically evoked Ca2+ transients were measured. N.S., not significant; A.U., arbitrary units; NFAT5, nuclear factor of activated T-cells 5; FDB, flexor digitorum brevis; TA, tibialis anterior; GAPDH, glyceraldehyde-3-phosphate dehydrogenase. (A color version of this figure is available in the online journal)

