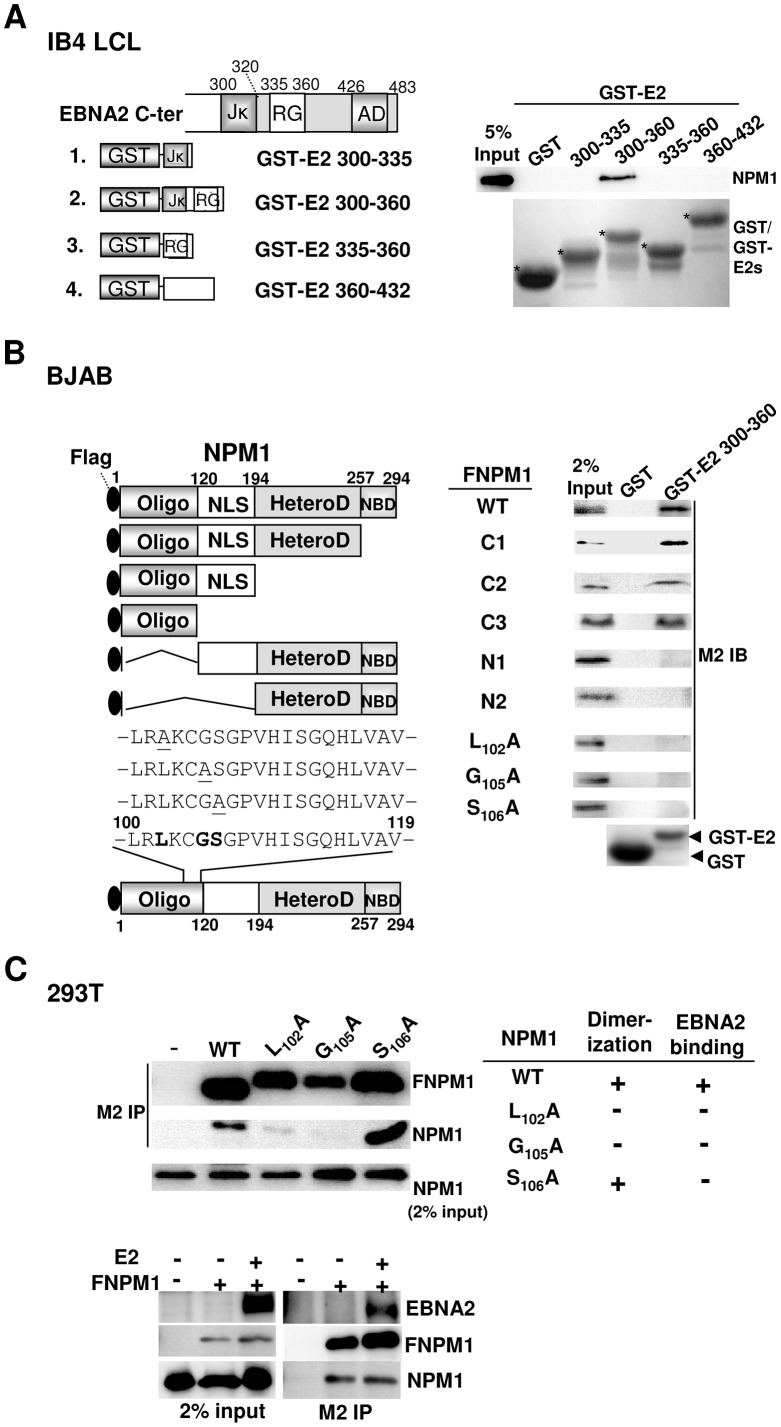
Figure 2. EBNA2 aa 300–360 and the NPM1 N-terminal OD are responsible for the specific physical interaction between the two proteins.
A). Schematic diagram of the GST-E2s used in this assay. The Coomassie-blue stained image for GST and GST-E2 fusion proteins (marked with asterisks). The amounts of endogenous NPM1 from the IB4 cell lysate pulled down by the corresponding protein baits were assayed by immunoblot analysis. Five percent input of NPM1 is shown. B). Schematic depiction of the flag-tagged wild type (FNPM1), truncated deletion, and point mutants of NPM1. The conserved amino acid residues are shown in boldface, and the mutated sequences are underlined. BJAB cells (107) transfected with 30 µg of the indicated expression vectors were subjected to protein affinity pull-down assays using GST 300–360 after 24 hours of transfection. The amounts of transfected FNPM1 and other mutants bound to the protein bait were determined by immunoblot with the M2 antibody (a flag-tagged specific antibody). Two percent input of each was used as a loading control. C). 293T cells (2×10⁶) transfected with 3 µg of the FNPM1 or the indicated NPM1 mutants expression plasmids were used for M2-IP analysis after 24 hours of transfection. The interactions mediated by endogenous NPM1 and the transfected FNPM1 or its mutant derivatives were determined (Lower panel). Two percent input of endogenous NPM1 is shown.

