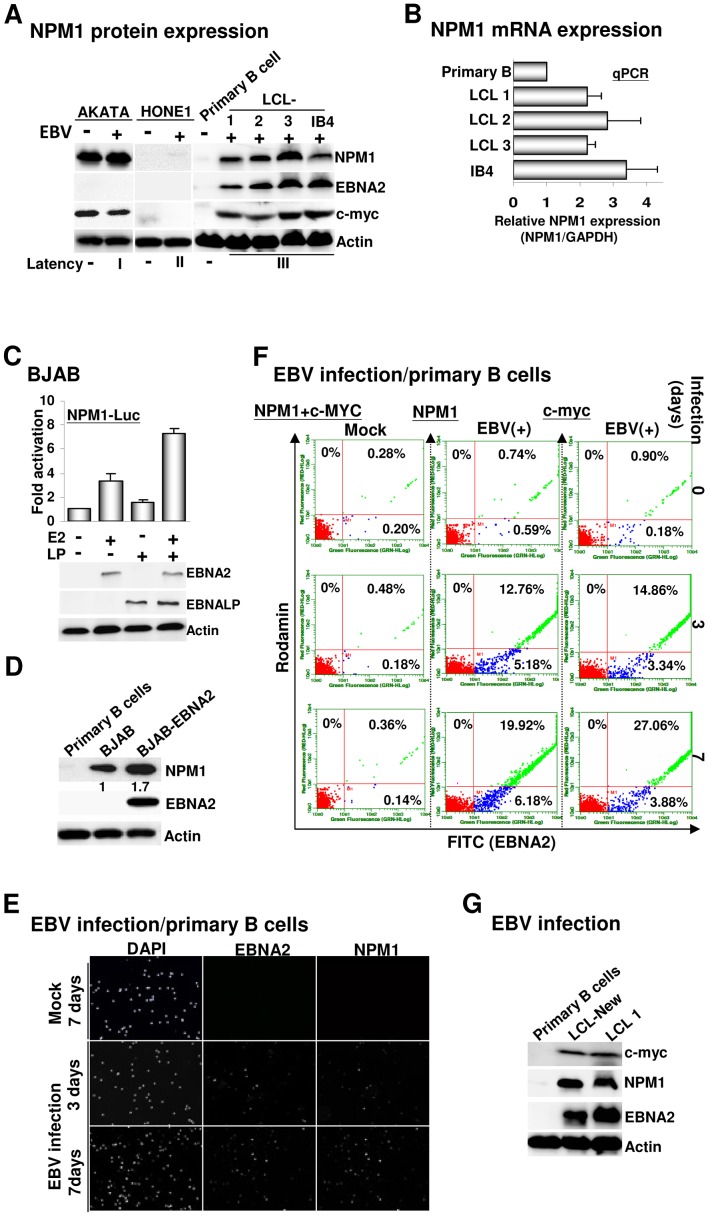
Figure 3. Activation of NPM1 expression is highly associated with EBV infection.
A). The immunoblots for NPM1, EBNA2, c-MYC, and actin control from EBV latently infected type I AKATA BL cells, type II HONE1 nasopharyngeal carcinoma cells (NPC), type III LCLs, and EBV negatively infected AKATA, NPC HONE1, and primary B cells. B). The mRNA expression levels of NPM1 in primary B cells and four individual LCLs were determined by quantitative real-time PCR (qPCR), respectively. The amount of NPM1 mRNA is expressed in relation to that of the GAPDH control. C). The effects of EBNA2 and EBNALP on the NPM1-Luc reporter plasmid were determined by the transfection-mediated reporter assay. Error bars represent the standard deviation from the mean for data from at least three independent experiments in this and subsequent figures. The immunoblotting images for transfected EBNA2, EBNALP, and the actin control are shown. D). The expression levels of NPM1, EBNA2, and actin in primary B cells, BJAB, or BJAB-EBNA2 were determined. E–F). Primary B cells (5×10⁴) were infected with EBV or PBS (Mock) and subjected to an IF staining protocol using antibodies for EBNA2 (v-C20), NPM1 (C-19), or c-MYC at 0, 3 or 7 days after infection (dai) followed by a donkey anti-goat antibody conjugated to FITC (Green) or a goat anti-mouse antibody conjugated to rhodamine (red). For mock infection, the Y-axis represented the signaling resulted from a double staining procedure using c-MYC and NPM1 antibodies, whereas the X-axis represented the signaling resulted from an EBNA2 immunostaining protocol. Nuclei were counterstained with DAPI. The immunostained cells were visualized by fluorescent microscopy and quantified by flow cytometry (F). G). The newly established LCL (LCL-New), or previously established LCL (LCL1) and primary B cells were assayed for EBNA2, c-MYC, and actin control expression levels.

