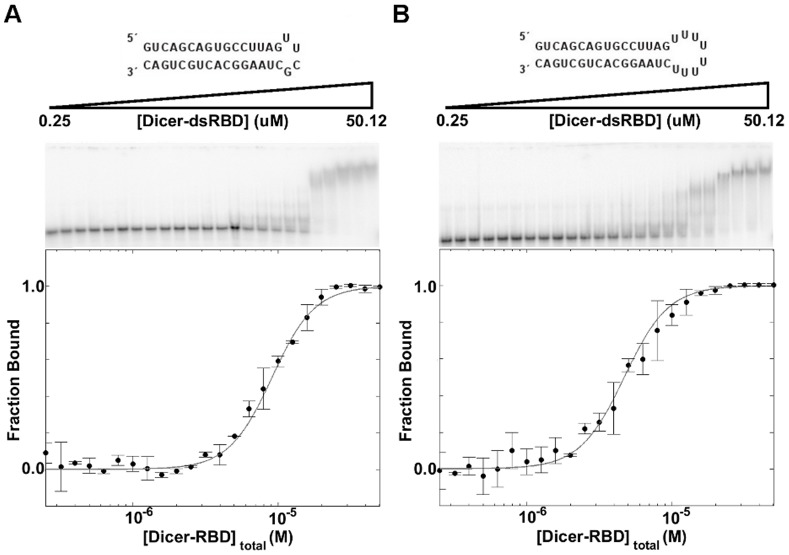
Figure 4. EMSA of ds16-tetra-stable and ds16-octa-U binding by Dicer-dsRBD.
EMSA of Dicer-dsRBD binding (A) ds16-tetra-stable with a Kd = 9.1±0.1 µM and (B) ds16-octa-U with a Kd = 4.7±0.1 µM. The predicted secondary structures of the RNAs are shown above the representative gels, which were run with various Dicer-dsRBD concentration (0.25–50.12 µM) binding to 0.125 nM RNA. Fraction bound, from the EMSA data, versus Dicer-dsRBD concentration was fitted using a generalized Hill cooperative model (gray line). Error bars in the plots of fraction bound as a function of total Dicer-dsRBD concentration represent the standard deviation from duplicate measurements.

