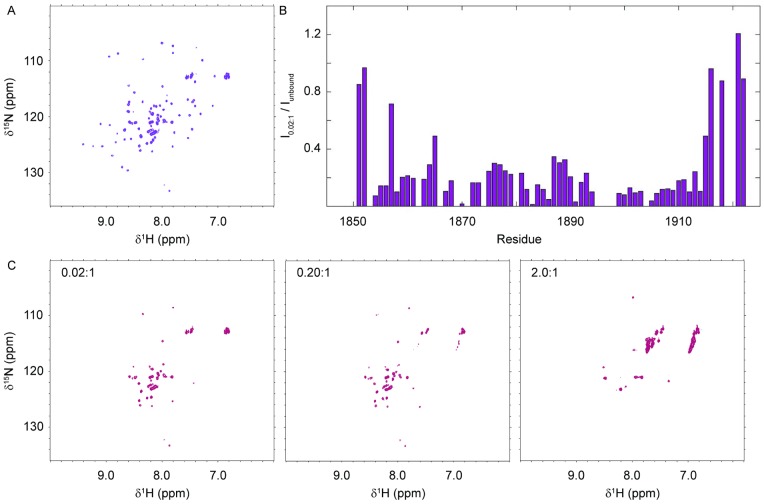
Figure 5. NMR titration of Dicer-dsRBD with ds33.
Representative 15N-HSQC spectra of Dicer-dsRBD collected in the unbound state and in the presence of ds33. (A) Reference spectrum of apo-Dicer-dsRBD. (B) Ratio of individual peak intensities in the presence of 0.02∶1 mole ratio ds33:Dicer-dsRBD to those recorded under identical conditions in the apo-state spectrum displayed in (A). (C) Representative spectra from the ds33 titration showing the data points with mole ratios of 0.02∶1, 0.20∶1, and 2.0∶1 ds33:Dicer-dsRBD as labeled. All spectra were collected at 25°C in the presence of 100 mM KCl on a spectrometer operating at 600 MHz field strength.

