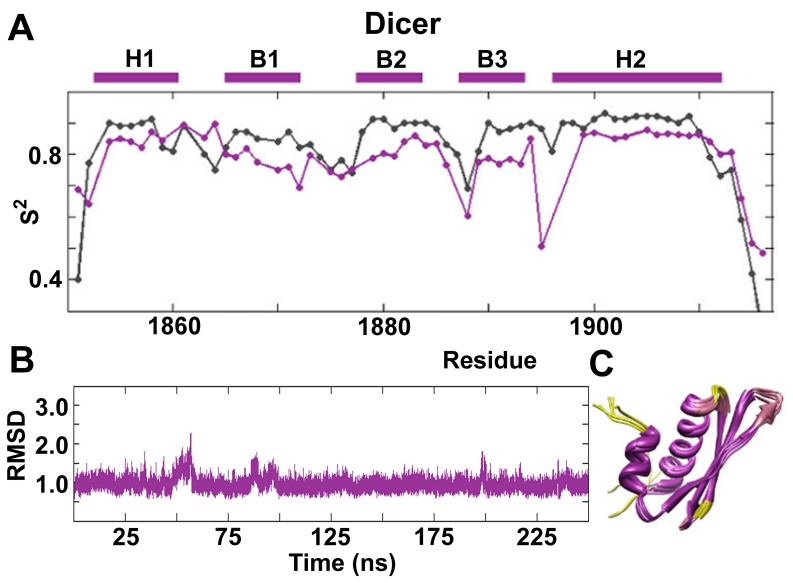
Figure 7. Order parameters and RMSD of Dicer-dsRBD along with PDB bundle.
(A) Order parameters (S2) plotted for Dicer-dsRBD show that the most flexible regions in the protein are loops 3 and 4. Experimental data (purple) is plotted with MD predicted order parameters (gray). The secondary elements are represented as purple bars above the plot. (B) The overall stability of Dicer-dsRBD during the 250 ns MD simulation is demonstrated by the low average RMSD (<1.0 Å). (C) MD-derived ribbon bundle for Dicer-dsRBD also shows the stability of the construct. Increased flexibility, derived from the experimental order parameters, is depicted colorimetrically on the ribbon bundle as passage from purple (high order parameter) to yellow (low order parameter). The bundle was created by taking structures from the simulation every 50 ns and superimposing them to remove translational and rotational motion.

