
Figure 8. Cα correlations of Dicer-dsRBD.
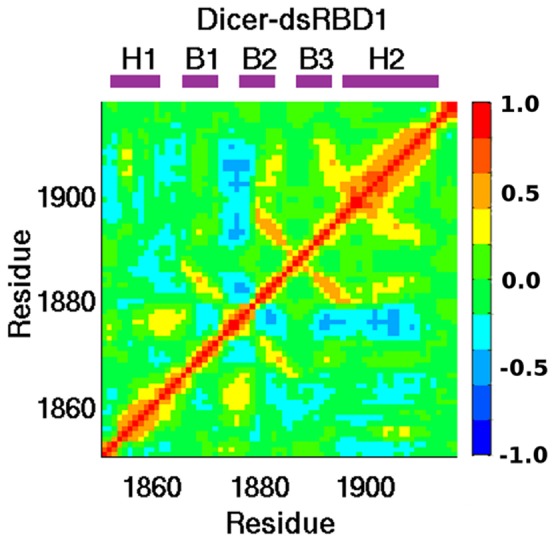
The Cα correlation matrix of Dicer-dsRBD reveals backbone motions. The color bar on the right shows the scale indicating strong positive correlation (red), strong negative correlation (blue), and non-correlated (green) motions. Labels above the panel indicate the location of secondary structural elements within the sequence.