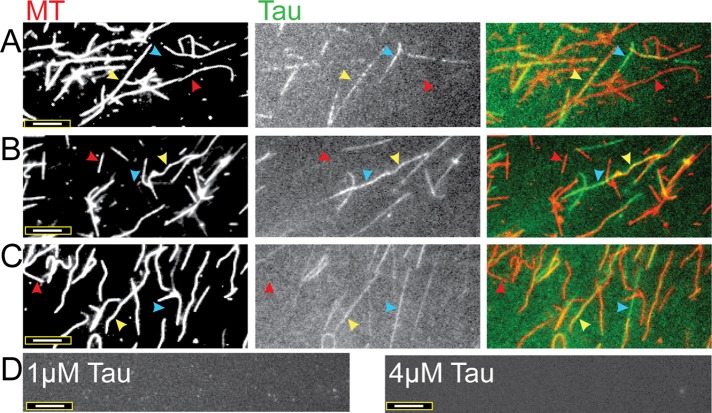
FIGURE 2:
Fluorescently labeled Tau and MTs reveal sporadic Tau–MT decoration and the formation of Tau filaments. Incubations of (A) 1 µM Tau:4 µM MTs, (B) 2 µM Tau:4 µM MTs, and (C) 4 µM Tau:4 µM MTs for 15 min at 37°C. Individual MTs vary from being sparsely decorated with Tau (red arrowheads) to being moderately and heavily decorated with Tau (yellow arrowheads). Tau filaments that are not associated with MTs are also evident (blue arrowheads). In the right-most panels, colored images display tubulin as red and Tau as green; the overlay of Tau and tubulin appears as yellow. (D) The results of control experiments performed with Tau protein alone at low (1 µM) and high (4 µM) concentrations, in which no Tau filaments are observed. Scale bars: 8 µm. The images shown represent the typical results of more than 10 independent experiments performed with Tau from multiple purifications and labeling reactions.

