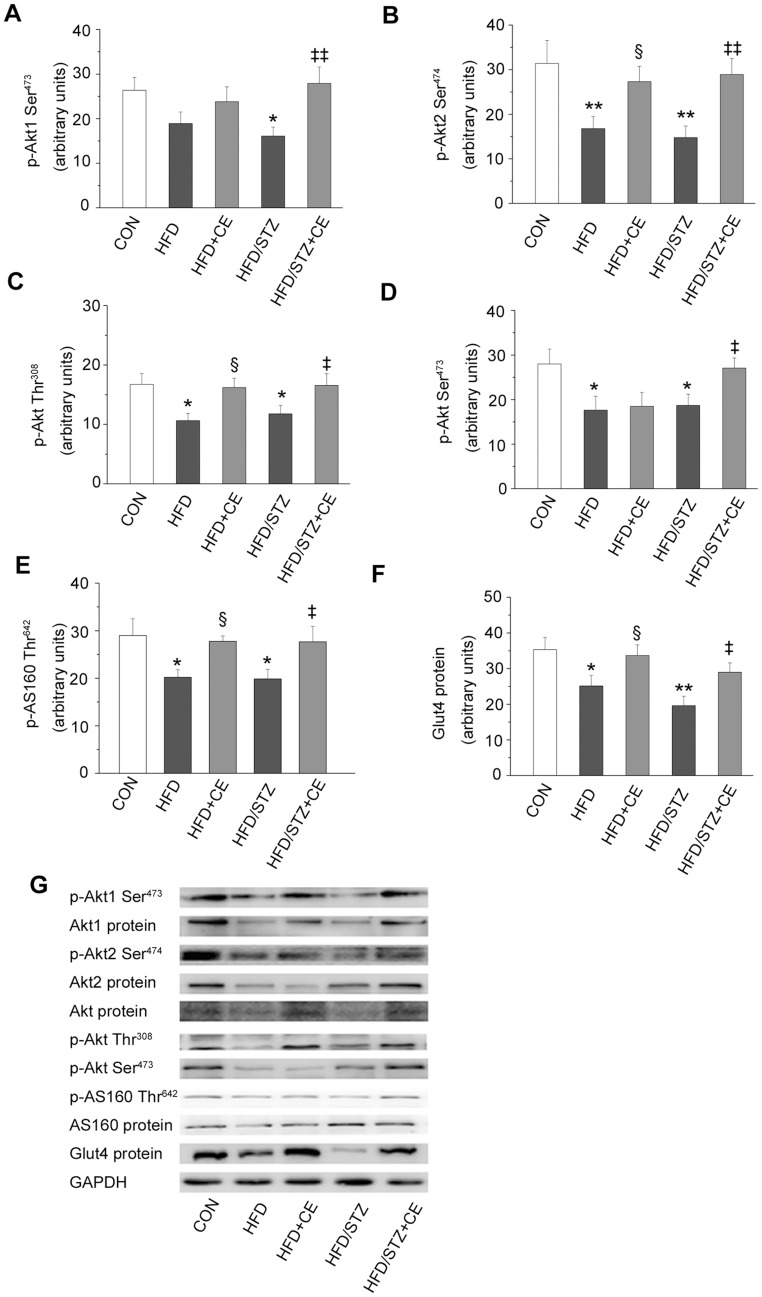
Figure 3. Effects of chronic exercise on components of the insulin signaling pathway.
A–F: expression levels of p-Akt1 (Ser473) (A), p-Akt2 (Ser474) (B), p-Akt (Thr308) (C), p-Akt (Ser473) (D), p-AS160 (Thr642) (E), and GLUT4 (F). G: representative western blots of the proteins of interest. Values are shown as mean ± SE. * P<0.05 and ** P<0.01 vs. the control group; § P<0.05 vs. the HFD group; ‡‡ P<0.01 vs. the HFD+STZ group. CON: control; HFD: high-fat diet; CE: chronic exercise; STZ: streptozotocin. N = 7–8.

