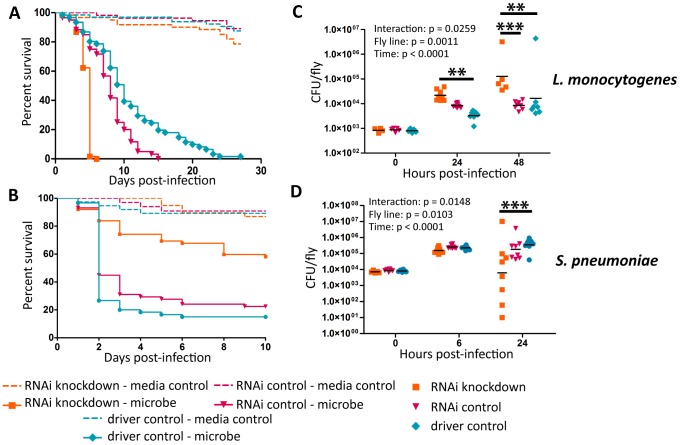
Figure 3. Ets21c phenotypes confirmed by RNAi knockdown.
L. monocytogenes or S. pneumoniae were injected into RNAi crosses and control flies. Survival and growth of the bacteria was monitored over the course of infection. (A),(C) L. monocytogenes; (B),(D) S. pneumoniae. Log-rank analysis of the survival curves gives p<0.0001 for all curves (w/o media controls in analysis). The significant sources of variation were assessed by two-way ANOVA and differences in bacterial load between the driven RNAi and the controls at each time point were assessed by the Bonferroni post-test after ANOVA and significantly different values denoted by asterisk (** p<0.01, *** p<0.001).

