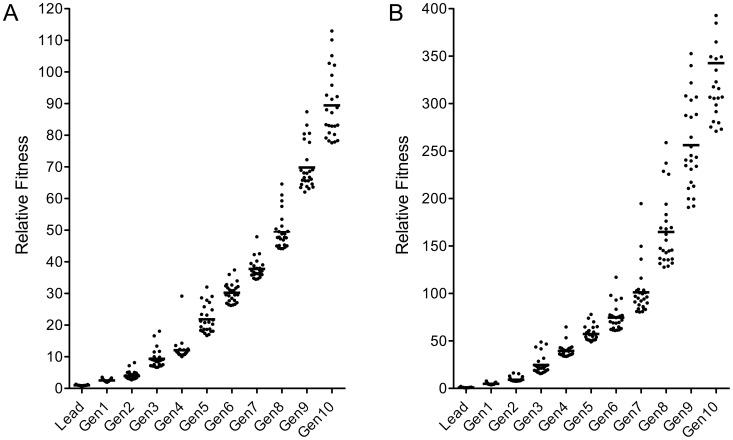
Figure 4. Increase in target-binding strength of peptide sequences in the course of the molecular evolution process.
A. L-peptides B. D-peptides. The relative fitness (compared to the lead peptides) of the 25 best lysoGM1/Dy650 binding peptides from each generation is shown. Horizontal bars indicate the arithmetic mean of the 25 best fitness values of each generation.

