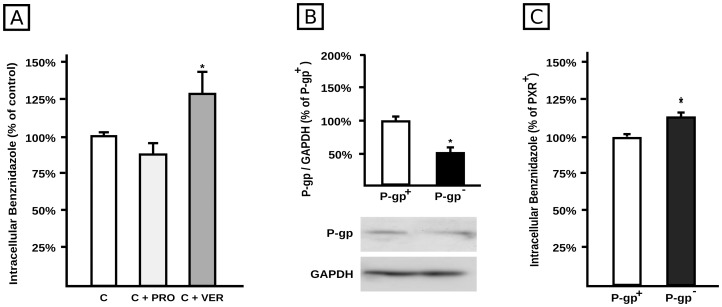
Figure 6. Role of P-gp in BZL transport.
A. Confluent HepG2 cells were loaded with BZL (100 µM, 2 h) in the presence of either verapamil (VER; 100 µM) or probenecid (PRO, 1 mM). Control cells (C) were exposed to inhibitors vehicle. BZL accumulation was determined in cellular lysates by HPLC. Data (means ± S.D, n = 3) are expressed as percentage of BZL accumulated in control cells. *Significantly different from all the other groups, p<0.05. B. P-gp levels were estimated by western blotting in lysates from HepG2 cells transfected either with 100 nM Control siRNA-A (P-gp+) or with 100 nM Mdr-1 (h) si-RNA (P-gp−). Equal amounts of total protein (7 µg) were loaded in the gels. O.D. from P-gp was related to GAPDH O.D. Typical western blot detections from both groups are shown at the bottom. The results (% of P-gp+ cells) are expressed as mean ± S.D. (n = 3). *Significantly different from P-gp+, p<0.05. C. P-gp+ and P-gp− cells were loaded with BZL (100 µM, 2 h). BZL accumulation was determined in cellular lysates by HPLC. Data (means ± S.D., n = 4) are expressed as percentage of BZL accumulated in P-gp+ cells. *Significantly different from P-gp+.

