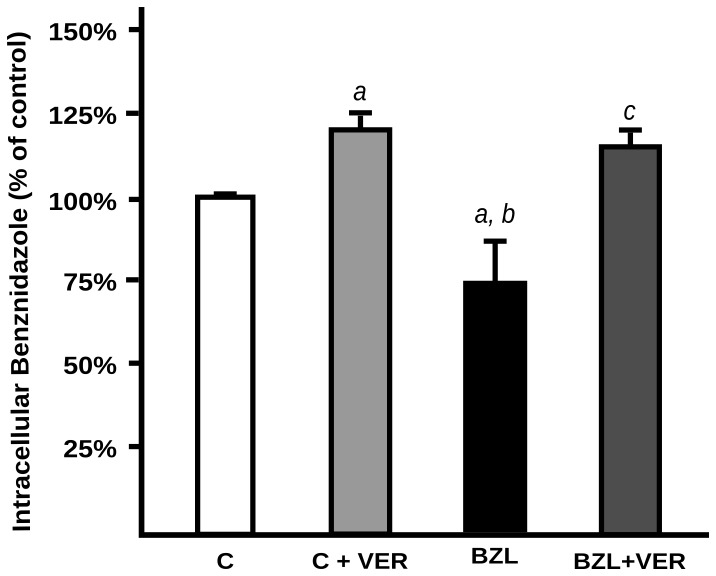
Figure 7. Effect of BZL on its own transport.
HepG2 cells were pretreated with BZL in conditions shown to induce P-gp expression (200 µM, 48 h) or (C) vehicle. Then they were loaded with BZL (100 µM, 2 h) with or without verapamil (VER; 100 µM). BZL accumulation was determined in cellular lysates by HPLC. Data (means ± S.D, n = 3) are expressed as percentage of BZL accumulated in control (C) cells. a: significantly different from C; b: significantly different from C+VER; c: significantly different from BZL, p<0,05.

