
Figure 3. Relationships of Ψ distribution and gene density in A. thaliana chromosome regions.
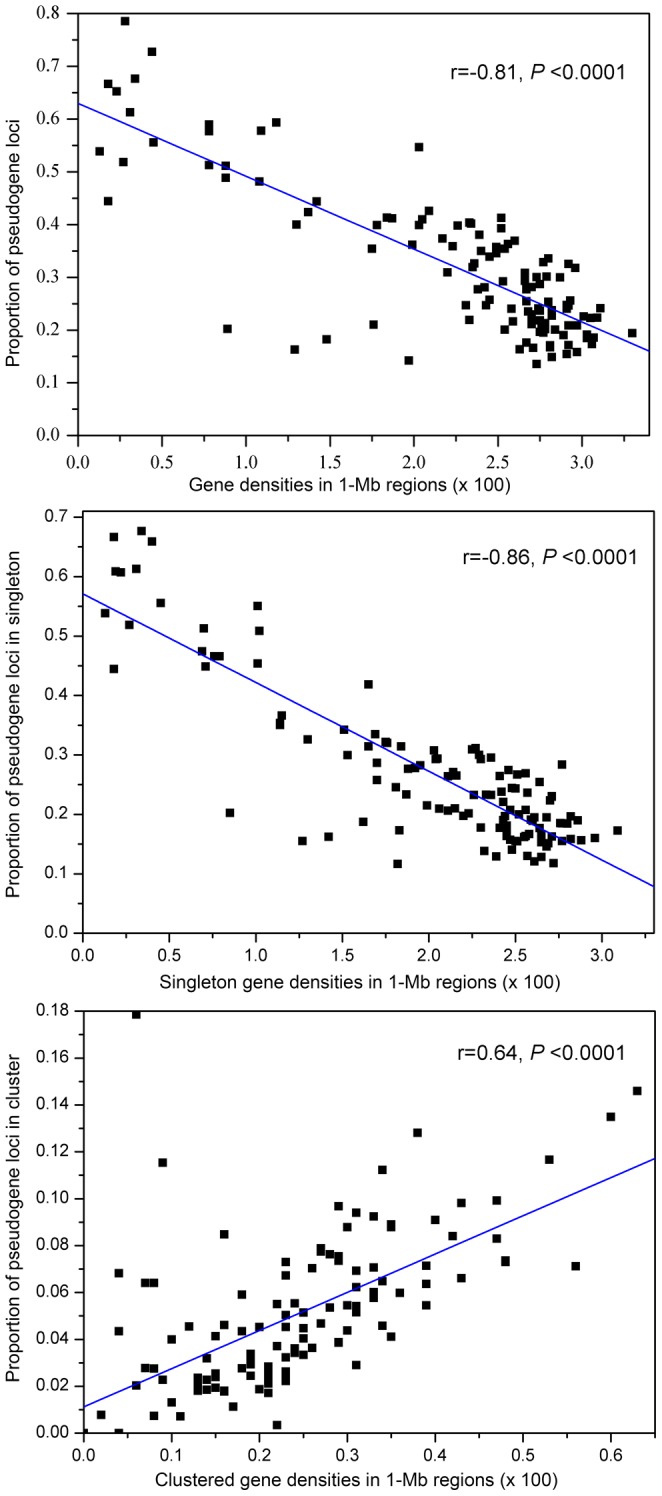
The gene density for each dot is counted by all genes in a 1-Mb region in reference genome of Col-0 and only protein-encoding genes were counted, including predicted and hypothetical genes, but excluding genes related to transposons. (A) A significantly negative correlation was detected between the proportion of pseudogene loci and gene densities, (B) The frequency of pseudogene loci located in singleton loci was also significantly negatively correlated with the singleton gene densities. (C) A significantly positive correlation was found between the frequency of clustered pseudogene loci and their gene densities.