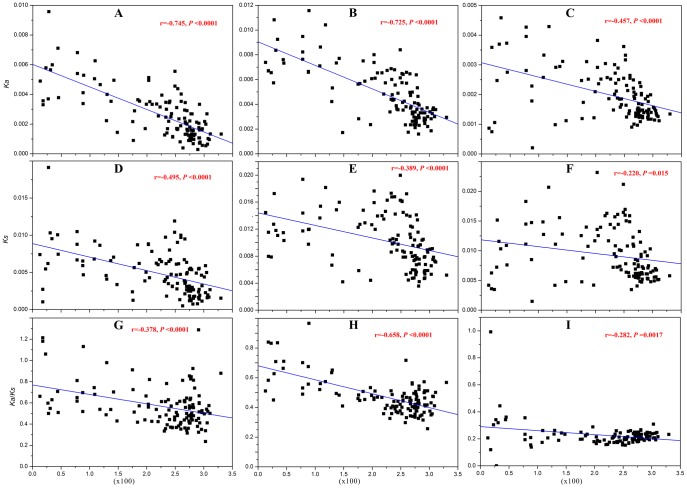
Figure 4. Relationships of non-synonymous (Ka) and synonymous (Ks) substitutions or their ratios (Ka/Ks) with gene densities.
In all plots, the X-axis represents the gene density estimated as the gene numbers in a 1-Mb region. The counts were for protein-encoding genes only, including predicted and hypothetical genes, but excluding genes related to transposons. The Y-axis represents the nucleotide substitutions. (A) Non-synonymous substitutions among disrupted alleles within Ψ loci; (B) Non-synonymous substitutions among intact alleles within Ψ loci in the 80 A. thaliana accessions. (C) Non-synonymous substitutions among intact alleles within non-Ψ loci. (D) Synonymous substitutions between disrupted alleles within Ψ loci. (E) Synonymous substitutions among intact alleles within Ψ loci. (F) Synonymous substitutions among intact alleles within non-Ψ loci. (G) Average Ka/Ks among disrupted alleles within Ψ loci. (H) Average Ka/Ks among intact alleles within Ψ loci. (I) Average Ka/Ks among intact alleles within non- Ψ loci.

