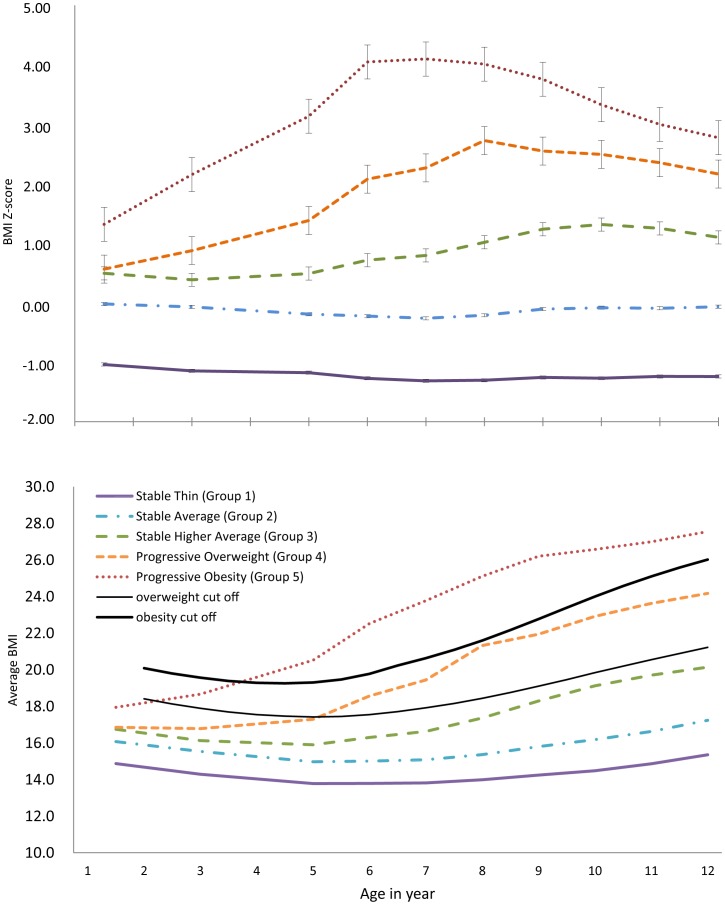
Figure 1. Trajectories of Body mass index (BMI) and the average BMI of boys aged 1.5 to 12 years in Koshu City, Japan, 1991–1998.
Error bars indicate the standard error of the mean for each observed group. Group 1, “stable thin”; Group 2, “stable average”; Group 3, “stable high average”; Group 4, “progressive overweight”; Group 5, “progressive obesity.”

