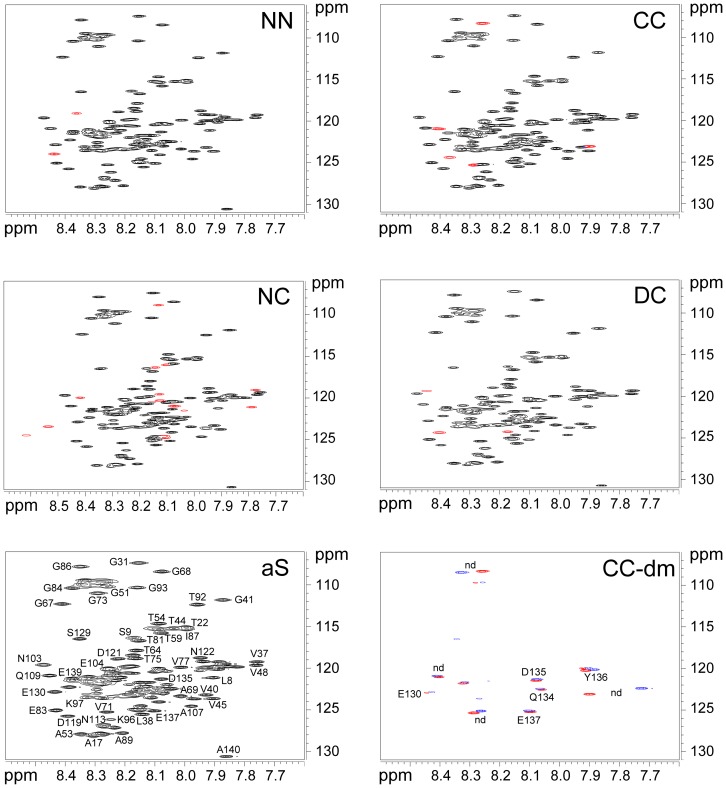
Figure 3. HSQC spectra of NN, CC, NC and DC dimers.
aS HSQS spectrum is reported with resonance assignments, where space permits. In red are indicated new peaks of dimers spectra that are not present in aS spectrum. For CC dimer, experiments were performed in the absence and in the presence of 10 mM DTT and the difference maps (CC-dm) was calculated by subtracting the data matrix obtained after 2 hours of incubation in the presence of DTT from the reference.

