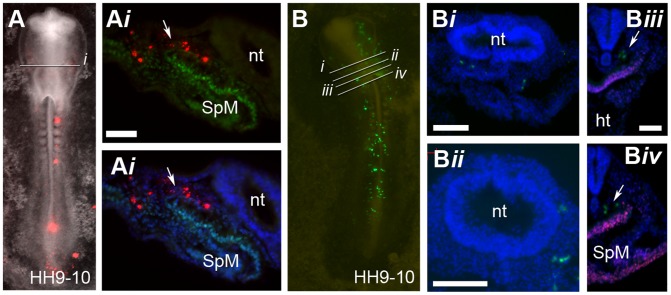
Figure 4. Descendants of cells from region A are located within the CPM at stage HH9-10.
(A) Bright field and fluorescent image showing the location of fluorescently labelled descendants of cells from region A at stage HH9-10 (red cells). (A i) Section through embryo in (A) showing location of labelled cells and Isl1 protein expression (green). DAPI signal (blue) has been superimposed to provide a clearer picture of the morphology of the tissue. White arrows in (A i) point to the CPM where fluorescent cells are located. (B) Bright field and fluorescent image of embryo at stage HH9-10 showing location of CAG-GFP labelled cells (green cells) which were grafted within region A of the primitive streak at stage HH3 though to HH3+. (B i – iv) Section of grafted embryo (B). (B iii – iv) Sections stained for Isl1 protein expression (red). Arrows indicate the location of CAG-GFP cells in the CPM. At stage HH9-10 CAG-GFP labelled cells grafted to region A were located within the CPM (n = 5). Splanchnic mesoderm (SpM), neural tube (nt), heart (ht). Scale bars (A i), and (B iii – iv) = 50 µm, (B i – ii) = 100 µm.

